Energy Consumption Monitoring and Optimization

Solution Group

Industry

Smart Grid
Energy and Utilities

PoC Duration

Iotellect Match

7-15 days
↓
AI powered Low Code IoT/IIoT Platform

Improve energy efficiency, enable demand response participation, and support predictive maintenance by detecting abnormal power patterns. Reduce carbon footprints, ensure compliance with energy regulations, and offer cost savings by identifying inefficiencies along with optimized energy usage. Use an IoT platform to quickly bring a new unique energy performance solution to your customers.

Iotellect is a low code IoT/IIoT development platform. It does not work as an out-of-the-box solution or product. Instead, it helps you to monetize your IoT know-how by dramatically lowering labor costs and cutting time-to-market for your product, service, or solution. It allows business-oriented IoT professionals to join the development process by converting their IoT market knowledge directly into product features and specific value delivered to your end customers.

Build Your IoT Application

Connect Your

Energy Consumption Monitoring and Optimization Devices

image
IoT gateways
image
Smart meters
image
Smart lights
image
Data loggers and recorders
image
Smart thermostats
image
Power quality analyzers
image
Sensors
for voltage, current, power factor, etc.
image
Energy management controllers
image
Renewable energy equipment
image
Load monitors
image
Smart plugs and outlets

Connectivity & Management

  • Utilization of wireless sensor networks to monitor energy use across large industrial facilities, enabling continuous data transmission from remote and distributed assets
  • Linkage of distributed energy resources (DERs) and grid infrastructure for real-time data flow, enabling utilities to monitor energy demand and optimize grid efficiency
  • Support for remote load balancing across facilities or grids, allowing energy companies to optimize energy distribution and avoid overloading power systems
  • Interlinking with renewable energy systems (solar, wind, etc.) to monitor energy production and consumption, ensuring efficient use of green energy within larger grid or industrial systems
  • Connection with advanced smart meters for precise real-time energy usage data from power grids, substations, or industrial plants, ensuring detailed consumption insights

Integration

  • Low code integration with Energy Management Systems (EMS)
  • Low code integration with SCADA systems
  • Low code integration with renewable energy management systems
  • Low code integration with Advanced Metering Infrastructure (AMI)
  • Low code integration with Enterprise Resource Planning (ERP) systems enables seamless synchronization of project data and resource management
  • Low code integration with grid management systems
  • Low code integration with Building Management Systems (BMS)

Analytics

  • Identification of detailed consumption trends over time, helping utilities and industrial users optimize energy usage by understanding peak demand periods and inefficiencies
  • Automatic detection of irregular energy usage patterns, such as spikes or sudden drops, helping operators quickly address potential equipment failures or inefficiencies
  • Analysis of energy consumption data against costs, enabling companies to calculate return on investment (ROI) for energy-saving initiatives or equipment upgrades
  • Monitoring of power quality factors like voltage, frequency, and harmonic distortion, allowing energy managers to detect issues affecting efficiency and equipment longevity
  • Tracking of energy consumption linked to carbon output, providing insights into environmental impact and helping organizations align with carbon reduction targets or sustainability goals
  • Breakdown of energy usage by departments, processes, or devices, helping large industrial or commercial users allocate costs more accurately and optimize energy usage

UI/UX

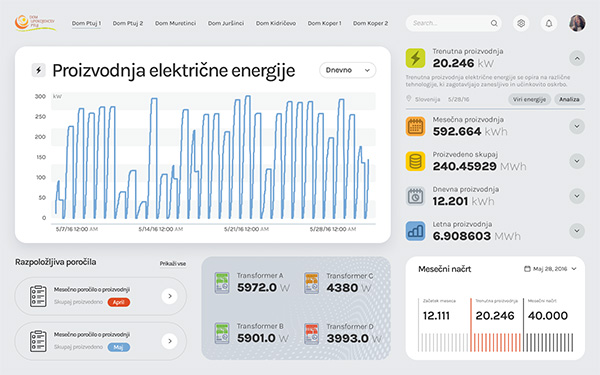
  • Display of live data on energy consumption, power quality, and system performance, providing a clear overview of current conditions
  • Visual representations of energy data, such as time-series graphs, pie charts, and heat maps, that make it easier to analyze consumption trends and anomalies
  • Mapping of energy grids and facilities with real-time data overlays, helping users quickly locate and address issues in different network segments
  • Centralized interface to manage alerts related to power outages, equipment malfunctions, or abnormal consumption, with options to view alert history and response status
  • Unified view of both energy consumption and operational data, enabling integrated monitoring and control

Key Features for Your
Energy Consumption Monitoring and Optimization Solution

Smart Power Grid

Related Demos

Balance a power grid of any size with ease. Aggregate data from each device and get detailed performance statistics across the whole infrastructure.

Create mimic diagrams as comlex as you need and bring them to life with the SVG Editor.

Customers and Partners

  • System Integrators
  • Small or Medium Businesses
  • Original Device Manufacturers
  • Independent Software Vendors
  • Engineering Companies
  • Government Agencies

Solution Users and Developers

  • Dedicated low code developers
  • SCADA/HMI engineers
  • Industrial automation specialists
  • Power engineering experts
  • Utility network engineers
Customer success team
Community
Online training

Assistance