Network Traffic Monitoring

Solution Group

Industry

Network Management
Information Technology

PoC Duration

Iotellect Match

1-3 days
AI-powered Low Code IoT/IIoT Platform

Improve network performance by identifying congestion and optimizing bandwidth usage, ensuring critical applications and services run smoothly. Troubleshoot issues quickly, minimizing service degradation and downtime. Enhance security by detecting cyber threats and unauthorized access attempts. Identify bottlenecks proactively and optimize network resource allocation, ensuring robust network management in heterogeneous IT environments.

Iotellect is a low code IT/OT and IoT solution development platform. It helps you to monetize your network or IT infrastructure operations knowledge by dramatically lowering labor costs and cutting launch time for your product, service, or solution. It allows business-oriented IT professionals to join the development process by converting their information technology industry knowledge directly into product features and specific value delivered to your internal or market customers.

Build Your IoT Application

Connect Your

Network Traffic Monitoring Devices

image
Routers
image
Switches
image
Firewalls
image
Traffic probes
image
Network flow (NetFlow/xFlow) collectors
image
Network Test Access Points (TAPs)
image
Packet sniffers
image
Deep Packet Inspection (DPI) appliances
image
Network performance monitoring appliances
image
Inline traffic decryptors
image
Intrusion detection and prevention systems
  • Direct integration with routers and switches to gather detailed traffic flow data, providing insights into bandwidth usage and network behavior
  • Secure data transmission between monitoring devices and management consoles using TLS encryption to protect against interception and tampering
  • Specify access permissions tailored to different IT roles, ensuring that only authorized personnel can view sensitive traffic data or make configuration changes
  • Configuration of alerts that trigger when specific thresholds (like unusual bandwidth spikes or abnormal protocol usage) are reached, helping to identify issues quickly

Connectivity and Management

  • Low code integration with Security Information and Event Management (SIEM) systems
  • Low code integration with Application Performance Management (APM) tools
  • Low code integration with Intrusion Detection and Prevention Systems (IDS/IPS)
  • Low code integration with Endpoint Detection and Response (EDR) tools
  • Low code integration with Network Access Control (NAC) systems
  • Low code integration with Virtual Private Network (VPN) systems
  • Low code integration with Firewall and Next-Generation Firewall (NGFW) systems
  • Low code integration with Data Loss Prevention (DLP) systems

Integration

  • Analysis of the contents of network packets to identify applications, protocols, and potential security threats, providing detailed insights into network usage and anomalies
  • Examination of NetFlow, sFlow, or IPFIX data to understand traffic patterns, identify bandwidth usage, detect network congestion, and optimize resource allocation
  • Usage of machine learning and statistical models to detect unusual traffic patterns, such as sudden spikes in traffic, potential DDoS attacks, or unauthorized data transfers
  • Tracking of user behavior and devices to identify deviations from normal activity, helping to detect insider threats or compromised devices
  • Measurement of network latency, jitter, and packet loss to pinpoint performance bottlenecks and optimize network efficiency for critical applications
  • Correlation of real-time and historical data to identify trends, forecast potential issues, and improve proactive maintenance and network planning
  • Investigation of specific applications' impact on network traffic and performance, identifying bottlenecks and optimizing application delivery

Analytics

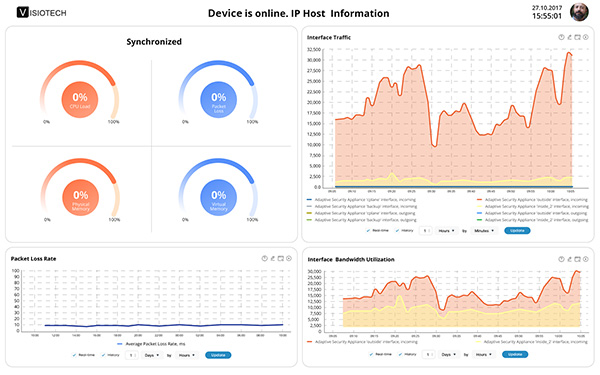
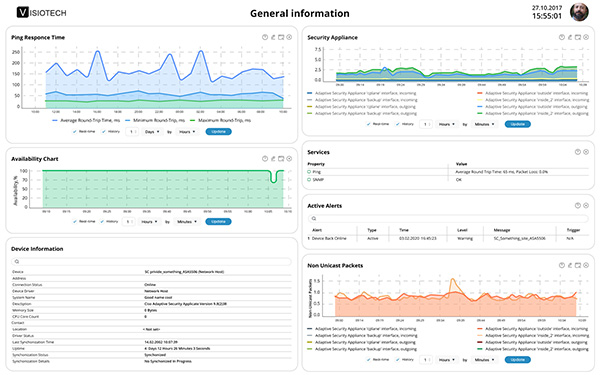
  • Interactive dashboards for live network traffic data, such as bandwidth usage, top talkers, and protocol distribution, allowing IT teams to monitor network health at a glance
  • Visual representations of network traffic across different segments or geographical locations, helping to quickly identify congestion points or potential issues based on traffic flow patterns
  • Availability of graphical tools for analyzing traffic trends over time, enabling users to compare current data with historical baselines to detect anomalies and plan for future capacity needs
  • Hover-over tooltips and annotations that provide additional context, explanations, or related metrics directly on the interface, helping users quickly understand the significance of data points

UI/UX

Key Features
for Your Network Traffic Monitoring Solution

Customers and Partners

  • System Integrators
  • Enterprises/Corporations
  • Telecoms/MSPs
  • Small and Medium Businesses
  • Network Hardware Manufacturers

Solution Users and Developers

  • Dedicated low code developers
  • NOC engineers
  • System and service administrators
  • IP network professionals
Customer success team
Community
Online training

Assistance

Ask us anything!

I have read, understood and accepted the Privacy Policy and Terms of Use of iotellect.com

Ask us how to start!

Great question!
We will answer you within one working day.
Sincerely yours, Iotellect Team.

Meet

Start building your IoT app or service by creating a new Application, or continue an already existing project

Install even more modules, plugins, and drivers from the integrated Marketplace

Configure and control every aspect of your Iotellect Server and manage its users with administration tools

Keep an eye on Server health and analyze its performance with the Monitoring dashboard

Find detailed tutorials on using the Platform and answers to a wide variety of questions in the Knowledge Base

Get inspiration from the practical examples found in the IoT business case Demos

Level up your Iotellect skills with the Platform Training Events and share your Platform experiences with our Community

Create and manage resources, set up the deployment environment, and configure the application from a single dashboard

Access the properties, configurations and countless features of every resource used in your current project from the Application Resources tree

Try the Tutorial on how to create a simple IoT application to understand the basics of building a functional IoT solution with Iotellect

Access the properties, configurations, and countless features of every resource in your Iotellect Server from the System Tree

Configure and control every aspect of your Iotellect Server and manage its users with Administration tools

Keep an eye on Server health and analyze its performance with the detailed Monitoring dashboard

Home Screen

Quickly access everything you need, whether starting a new session on the Platform or continuing from where you left off

Development

Build IoT applications of any complexity with ease in a simple, yet powerful, dedicated workspace

Administration

Manage and monitor your Iotellect Server instance, its users and all created resources

improve your business with a perfectly self-tailored

or win more clients with a new

market product

in-house service

Proved Worldwide
Across Industries
image
image
image
image
image
image
image
image
image
image
image
image
image
image
image
image
image
image
image
image
image
image
image
image

15 000 000 000 000+

data samples collected and processed

image

25 000 000+

devices under monitoring and supervision

image

40 000+

types of devices and data sources connected via more than 50 supported communication protocols

image

300+

SaaS and on-premise partner products created

image

80+

countries leverage Iotellect technology

image