Router and Switch Monitoring

Solution Group

Industry

Network Management
Information Technology

PoC Duration

Iotellect Match

2-10 days
AI powered Low Code IoT/IIoT Platform

Automate network administration by monitoring and managing business-critical routers, switches, and wireless access points. Enable traffic decomposition, early detection of issues, and proactive troubleshooting that reduce downtime and optimize resource allocation. Use flexible alert delivery and escalation matrices to react on serious incidents properly, prevent security breaches, and ensure compliance. Leverage monitoring platform's scalability, fail-over management, and detailed reporting so that networks remain adaptable and resilient, improving overall user experience and ensuring networks meet performance benchmarks and SLAs.

Iotellect is a low code IT/OT and IoT solution development platform. It helps you to monetize your network or IT infrastructure operations knowledge by dramatically lowering labor costs and cutting launch time for your product, service, or solution. It allows business-oriented IT professionals to join the development process by converting their information technology industry knowledge directly into product features and specific value delivered to your internal or market customers.

Build Your IoT Application

Connect Your

Networking Equipment

image
Routers
image
Switches
image
Load balancers
image
Access points
image
Firewalls
image
Gateways
image
Traffic probes
image
Endpoint devices
(servers, printers, IP phones, etc.)
  • Support for different protocols like SNMP, ICMP, NetFlow, and sFlow, ensuring compatibility with various network devices
  • Extension of connectivity monitoring to wireless access points and wireless devices for seamless oversight
  • Automation of backup, restore, and change management for router and switch configurations
  • Automatic detection and pairing of network devices for easier monitoring and management
  • Scheduling of firmware updates for routers and switches, ensuring they run the latest software without manual intervention
  • Detection of unusual traffic patterns, unauthorized access attempts, or abnormal device behavior, flagging potential security breaches

Connectivity and Management

  • Low code integration with Network Management Systems (NMS)
  • Low code integration with Incident Management and IT Service Management (ITSM) tools
  • Low code integration with cloud management platforms
  • Low code integration with firewall and security systems
  • Low code integration with load balancers and traffic optimization systems
  • Low code integration with Configuration Management Databases (CMDB)

Integration

  • Analysis of traffic flow patterns, helping to pinpoint network congestion, identify heavy users, and understand data flows across the network
  • Performance monitoring of specific applications running on the network, identifying those consuming high bandwidth or causing latency issues
  • Aggregation of historical network data to identify trends, such as recurring outages, high-traffic times, and seasonal performance changes
  • Usage of machine learning to forecast future network needs or potential issues based on past data, aiding in capacity planning and resource optimization
  • Insights for detected security threats, such as DDoS attacks or port scanning, helping to strengthen network defense strategies
  • Tracking of device uptime and network availability, ensuring optimal performance and meeting SLAs
  • Prediction of future network usage and capacity needs, based on current and historical data, allowing for better resource planning
  • Analysis of network traffic based on geographic location, helping organizations understand where their network resources are being utilized the most

Analytics

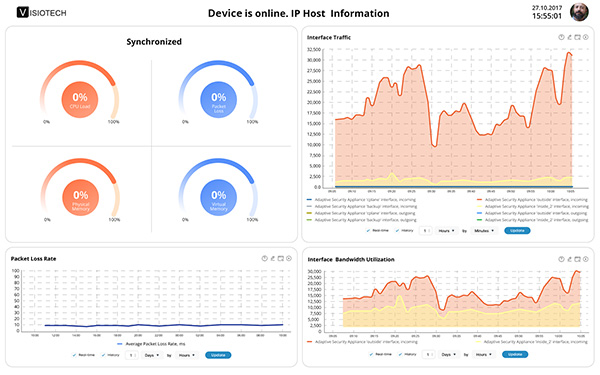
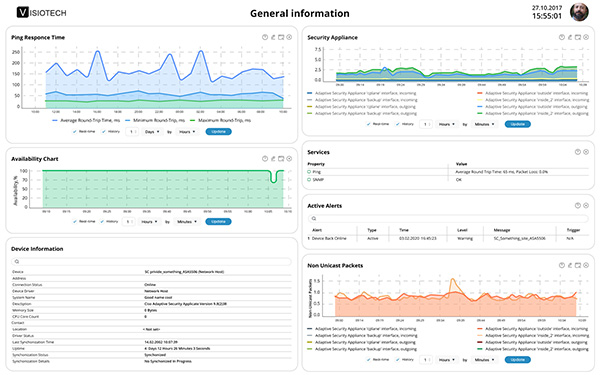
  • Overview of network health, traffic, and device status through charts, graphs, and metrics
  • Visual representations of the network topology, showing how devices connect and interact
  • Visual insights for the network topology, highlighting traffic paths, device interactions, and potential bottlenecks across various regions
  • Usage of visual cues like color codes (red, yellow, green) to indicate the severity of issues, making it easy to identify critical problems
  • Support for features such as zoom in, hover over, and click on devices or links for real-time performance data, making it easier to identify issues

UI/UX

Key Features
for Your Router and Switch Monitoring Solution

Customers and Partners

  • System Integrators
  • Small or Medium Businesses
  • Enterprises/Corporations
  • Telecoms/MSPs
  • Original Equipment Manufacturers

Solution Users and Developers

  • Dedicated low code developers
  • NOC engineers
  • IoT solution architects
  • IP network professionals
  • IT infrastructure managers
Customer success team
Community
Online training

Assistance