Visualization
The only off-the-shelf UI of Iotellect is the interface for platform administrators, DevOps engineers and low code developers. However, this is essentially the UI for building UIs of your products and solutions.
Iotellect’s end user interface building bricks and the Web UI Builder ensure that any artwork provided by your design team will be implemented as a working web application in low code. At the same time, all UI components are fully adopted to the unified data model, making them naturally compatible with any backend logic of your app.
Web UI Builder
Iotellect’s Web UI Builder is a visual interface editor designed to implement any of the above UIs with no coding. It offers a unique combination of components, layouts and configuration properties to ensure pixel-perfect following of any graphical template.

Interfaces of IoT applications are extremely diversified:
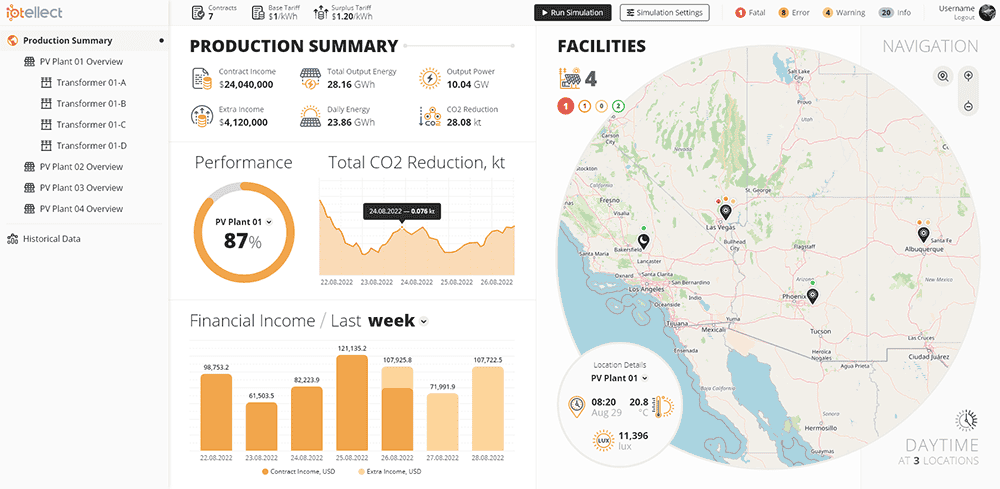
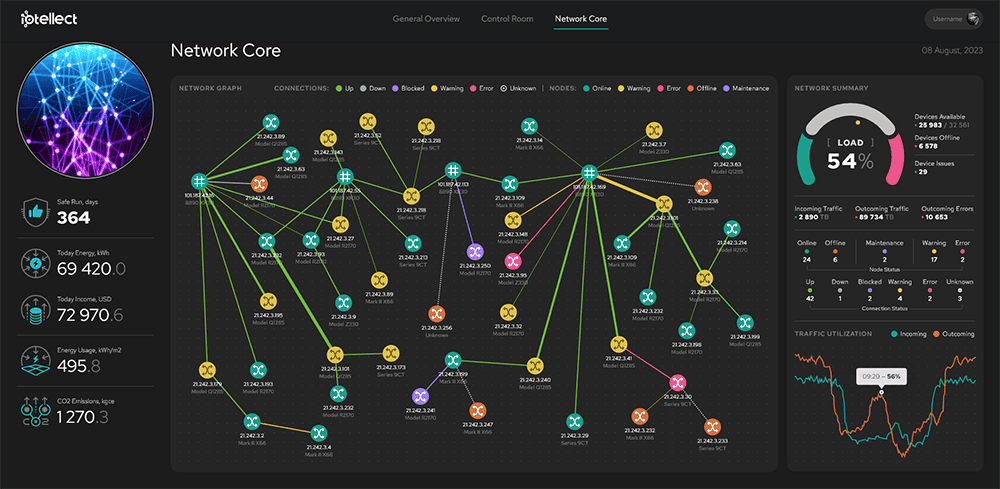
Classic IoT apps rely on geographical maps and “bestselling” connected asset dashboards
Industrial solutions leverage HMIs and advanced time series charts that can run on touch panels and desktop operator workstations
Data-centric analytical services rely on visual data preparation workflows
Executive dashboards assume BI-style interfaces with greatly varying diagrams and pivot tables for navigating company-wide statistics
Other UIs may feature complex data entry forms, facility/floor plans, and much more
Data bindings flexibly attach UI component properties to the underlying unified data model, enabling event-driven behavior within any type of interface.
50+ types or components and containers available out-of-the-box guarantee that you might refer to the Iotellect’s UI Component SDK only in really rare cases - and the whole power of all available React components is under your control for any such case.
IoT and BI Dashboards
Dashboards are primary bricks of a user interface. A set of navigable dashboards allows drilling down from top-level executive statistics to the detailed information on individual devices and services.
Grouped together, dashboards constitute the UI of every Iotellect-based product. Custom platform-based solutions are also based on dashboards built during the initial solution implementation phase and further turned during the mundane operations.
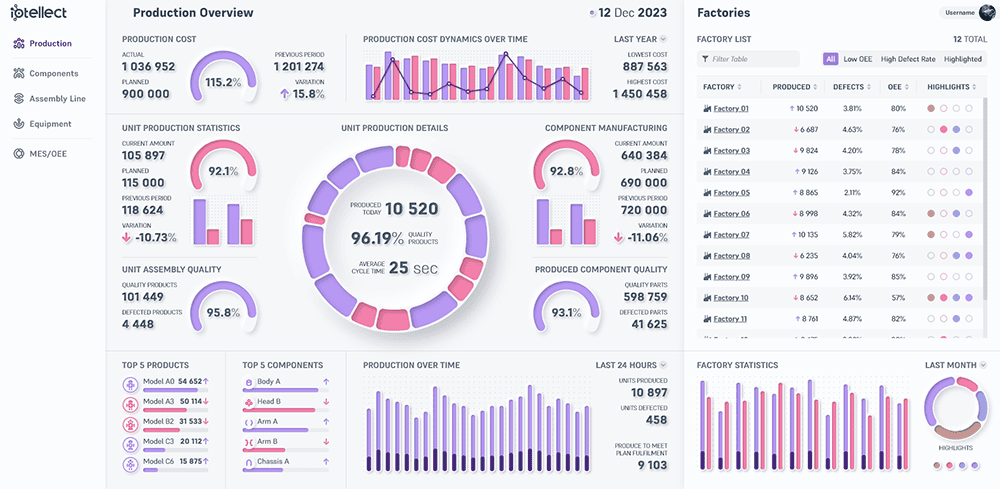
Each dashboard comprises a hierarchy of containers: panels, tabbed panels, drawers, and other. Each container may use one of three layout types: grid layout based on CSS Grid technology, absolute layout for pixel-precise component positioning, or dockable layout that allow end users to re-position components by attaching them to each other with the mouse.
Containers, as it appears from their name, contain nested containers or regular UI components: text fields, buttons, checkboxes, date and time pickers, tables, event logs, property grids, trees, charts, maps, graphs, gauges, raster and vector images, video windows, HTML snippets, etc.
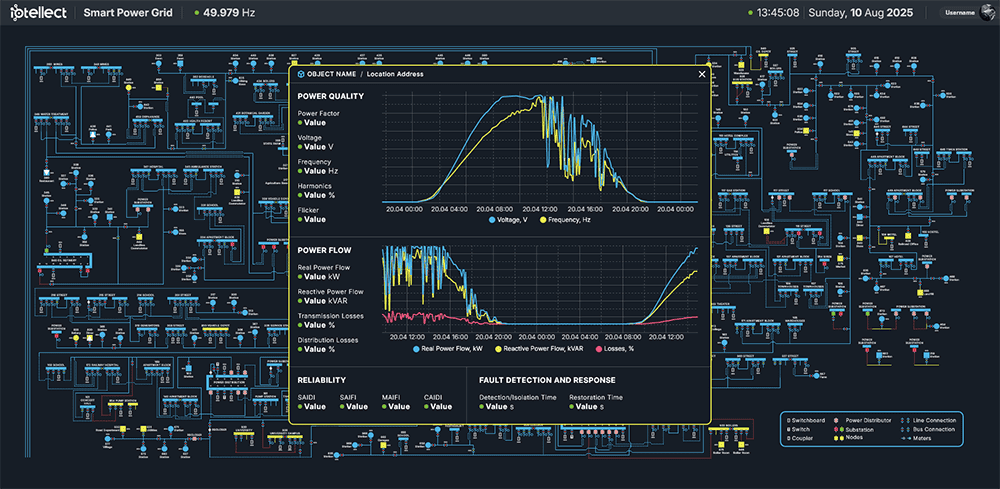
SCADA HMI and SVG Editor
When Iotellect is used as an industrial or building automation solution, its typical UI is a set of SCADA/BMS-style Human-Machine Interfaces (HMIs) that visualize status and provide control for an industrial process or facility infrastructure. Those HMIs are typically dashboards with dynamic industrial automation symbols, such as switching valves, rotating mixers/fans, or tanks with visualized liquid levels. The HMIs can be designed either for high-res displays (video walls, desktop operator workstations) or low-res displays (shop floor touch panels, tablets, and even smartphones).
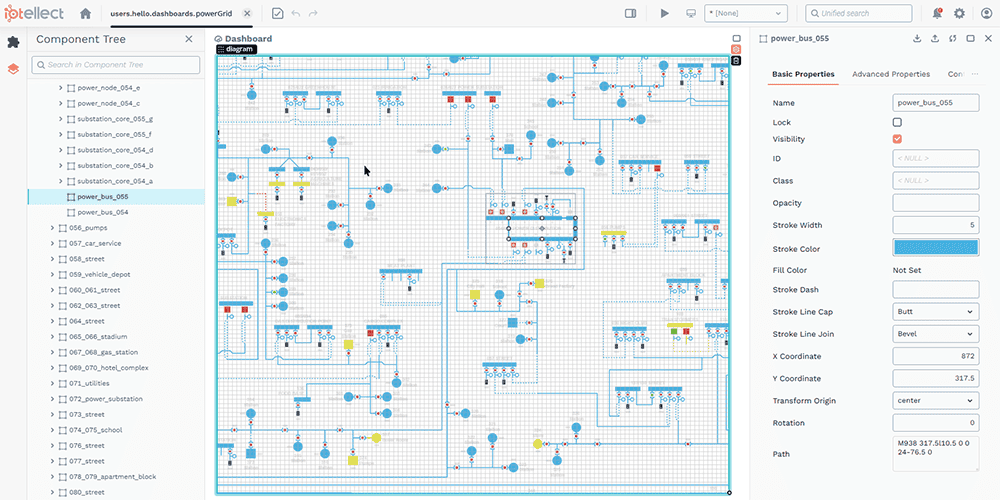
Iotellect’s Web HMI/SVG editor is a perfect tool for building industrial automation HMIs. It offers containers with absolute positioning, support for dynamic SVG graphics, and even templates allowing to reuse complicated pieces of UI, such as production lines. Moreover, the SVG editor allows the design of rather complex vector symbols without any third-party vector graphics editor, right within the platform's user interface. This is crucial to keep your SVG symbols fully in line with the devices and digital twins that they represent.
Iotellect also provides a large automation and control symbol library including thousands of flexible and configurable HMI symbols divided into multiple categories, such as arrows, ducts, pipes, mixers, motors, boilers, blowers, controllers, conveyors, pumps, electrical symbols, meters, valves, vehicles, sensors, basic shapes, and many other.


Spreadsheets
Many industrial IoT solutions, such as SCADA, MES, BI, or predictive maintenance, require rapid, complex and extremely flexible calculations over the industrial data. Such calculations are traditionally performed in electronic spreadsheets. Some teams might use pre-configured and pre-designed spreadsheets (which look more like spreadsheet-style reports) while other teams would prefer using ad-hoc formulas and views and draft them very quickly, almost in real time.
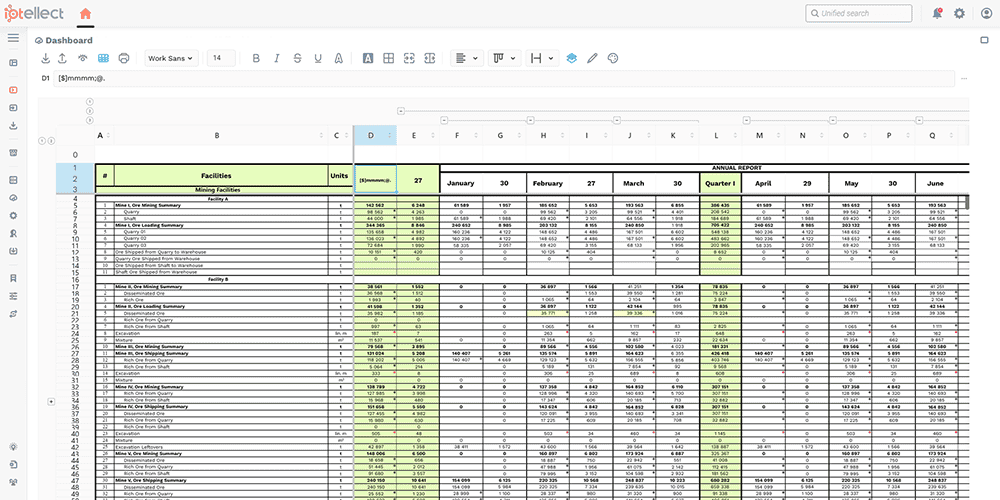
The existing IIoT platforms use integrations with third-party spreadsheet engines (such as Microsoft Excel or Google Sheets) as a solution. While this might look visually acceptable, such a solution has a huge disadvantage: all spreadsheet formulas are only working within the spreadsheet itself, missing direct references to industrial data streams, such as PLC/SCADA tag updates. This leads to an IIoT platform and a spreadsheet acting as two separate systems having misaligned data models, different formula languages, lack of two-way realtime data exchange, inconsistent UI/UX processes, as well as obvious access control and security flaws.
While the third-party spreadsheet platform integration is also possible with Iotellect, we offer a much better solution as a standard. Iotellect's own spreadsheet engine and the advanced Spreadsheet UI component are offering most of classic spreadsheet features including formulas, ranges, grouping, filtering, cell styling, conditional formatting, and much more. All formulas are implemented via Iotellect's expression language, which has direct support for many standard spreadsheet functions, offering analogs for others. Operations of Excel spreadsheet export/import perform formula auto-conversion, simplifying migration from older systems. Access to each cell and evaluation of each formula is fully respecting the platform's access control policies.
Printable Reports
In contrast to fully dynamic dashboards, reports offer printable data presentation. In practice, reports are mostly exported to PDF and similar formats for keeping and sharing them as files rather than actually printing on paper.
Building a report is a simple low code process:
- First, you use the Expression Builder to extract the report's dataset from the unified model.
- Second, Iotellect generates a report template for representing this data according to your preferences for paper size, fonts, colors, column width, grouping, etc.
- Finally, you can use the desktop Report Editor application to fine-tune the template, add logos and charts, adjust colors and fonts, re-format data, implement subreports, etc.
