Event Filters
Event Filters simplify real-time monitoring that is an important feature of most IoT solutions and apps. Smart devices generate billions of events per day in a large system, but operators manually handle a very small percent of them. Filters help to figure out the most significant events that require human intervention.
A filter can hide insignificant events and highlight the most important ones based on their source, type, level, and parameters. Essentially, a filter is a set of rules that determine what and how is shown by the Event Log component in the Iotellect Server app’s user interface. They adjust visualization of incoming events to suit the user's business role.
A filter is owned by the user who created it, but it can be shared between users through the flexible permissions setup.
Events can be filtered by:
Source - device, a group of devices, a system resource, or a group of resources
Event type
Event level - severity
Acknowledgements and enrichments
Any custom criteria defined by expression
The ability to filter by expression makes event filters highly flexible. Here are some examples of filtering that can be accomplished by an expression:
Finding events fired within a specific date/time range
Finding Login events of a specific user (i.e. filtering by username)
Finding all events that contain a certain substring in any of their data fields
Finding all temperature readings collected when the temperature was higher than a certain threshold.
Filtering events matching condition X and/or condition Y, or more complex combinations
In addition to the selection criteria, filters include event list visualization rules:
Visibility of event's basic parameters, i.e. source, type, level and acknowledgements
Visibility of individual event-specific fields
Custom expression-based and level-based highlighting rules
Besides browsing-level filters, each server has pre-filtering rules to discard certain events before they are saved to the database or routed to any destination.
A filter can be parameterized to prompt an operator for certain parameters each time it is activated.
Iotellect-based vertical market products include sets of built-in filters for viewing industry-specific system events, device events, alerts, etc.
 | Every user has their own set of event filters. |
 | Creating event log filters when working with large data sets can significantly increase the memory usage of Iotellect Server. |
Working with Event Filters
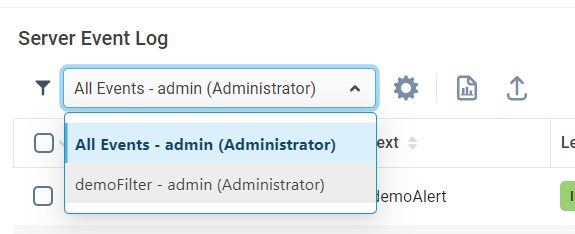
To start using an event filter, the user must activate it by selecting it from the Filters drop-down list in the Event Log component:

The Event Log component has two sections:
Real-time events, showing events as they are fired
Event history, showing past events
Filters may be selected separately for each section. If a filter is selected in the Real-time Events section, the Event Log starts listening for all categories of events listed in the Filter Rules table. When a filter is selected in the Event History section, Iotellect Server loads all events satisfying the Filter Rules list (see below) from the database and shows the first few rows, allowing the user to scroll through the whole list or sort it.
The most important property of an event filter is Filter Rules, defining which events to show. During filter activation, every Enabled record in the Filter Rules table is processed, and events satisfying the following conditions are shown in the event log:
The context in which the event fired must match the Context Mask
If Event Name is not equal to "*" (All Events), the name of the target event must exactly match the Event Name field.
The event's level must be greater than, or equal to, the severity level specified in the Level field
The event must satisfy the Filter Expression
Each of the field names in bold above, are described below. Each filter record may also specify a highlighting color that will be used to highlight events of this category in the Event Log.
 | The highlighting color defined in the Filter Rules record can be overridden by Custom Highlighting rules. |
By default, the following columns are visible in the Event Log:
Server Timestamp. Date and time when this event was registered by Iotellect Server. This column cannot be hidden.
Context. Description and/or path of the context where event has been occurred. This column shows descriptions of contexts by default. Context paths are only displayed if the Show context paths along with their descriptions setting is enabled in Filter Info. This column can be hidden by disabling the Context Name setting in Primary Visible Fields.
Event. Event name and/or description. This column shows event descriptions by default. Event names are only shown if the Show event names along with their descriptions setting is enabled in Filter Info. This column can be hidden by disabling the Event Name setting in Primary Visible Fields.
Level. Event level. This column can be hidden by disabling the Event Level setting in Primary Visible Fields.
Data. String representation of the Data Table associated with the event. This column may show field names and values or values only, depending on the Show field names setting in Filter Info. It may be hidden by disabling the Event Data setting in Primary Visible Fields.
Acknowledgement. Event acknowledgement. This column may be hidden by disabling the Acknowledgement setting in Primary Visible Fields.
 | See the Event Log article in the Iotellect Client manual for more information about event monitoring. |
Administering Event Filters
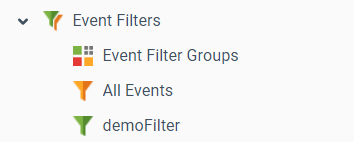
Two contexts are used to administer event filters: one is the general Event Filters context, which serves as a container. The other is the Event Filter context, which holds the information for a single filter.

Event Filter Structure
Each event filter has several properties:
Filter Info. The name and description of the filter, and some other basic settings
Filter Rules. A list of events (or rather, event types, for we're not talking about specific event instances here) that are shown in the Event Log when the filter is active
Primary Visible Fields. The visible properties of events shown when the filter is active
Additional Visible Fields. These are additional fields, containing event-specific data. They control which of the "additional" fields are displayed in the Event History for this event. For example, the login event has a username field, indicating what user logged in. This field is used only for the login event, there's no use for it in an alert event (for example). thus it's contained within the Data Table for the login event (and there's no such field in the data table for the alert event). The content of this field depends on the event types which were selected in Filter Rules.
Custom Highlighting. Rules for assigning different colors to events when they're shown in the Event Log.
The Filter Rules property defines which events are shown when the event filter is active, while Filter Info, Primary Visible Fields and Additional Visible Fields describe which parameters and fields are shown for every event. More information about filter properties can be found here.
Filter Expressions
Filter expressions are used to fine-tune filtering and color-coding rules. See Filter Expressions for more information.
Event Highlighting
Events shown in the Event Log can be color-coded according to different rules. See Event Highlighting for more information.
Parameterized Filters
Some filters may require system operators to adjust filtering parameters upon filter activation or reactivation. Such filters are called parameterized filters. See Parameterized Filters for details.
Was this page helpful?