Symbol Axis
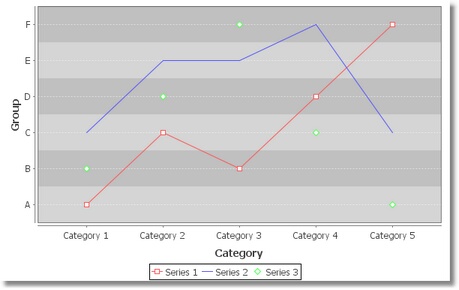
Symbol Axis is a subtype of the value axis that maps integer values (starting at zero) to symbols (strings).
Additional properties of a symbol axis:
Property | Name | Type | Description |
Symbols | symbols | Data Table | A table with value labels, that has two fields:
|
Grid Bands Visible | gridBandsVisible | Boolean | Flag that controls whether or not grid bands are painted for alternate tick values. |
Grid Band Paint | gridBandPaint | Data Table | Paint used to color alternate bands within the plot area. |
Grid Band Alternate Paint | gridBandAlternatePaint | Data Table | Paint used to all alternate bands within the plot area. |
A line chart where the range axis is a Symbol Axis:

Was this page helpful?