Spider Chart
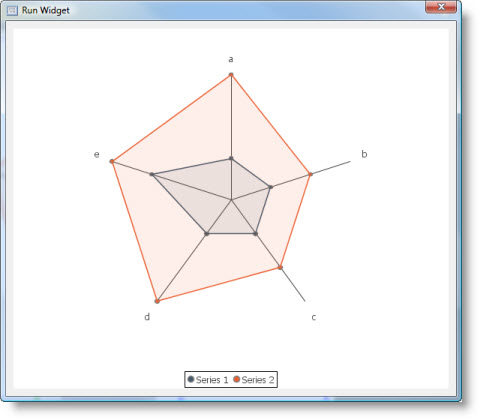
A spider chart displays (Category, Value) data items in a format that resembles a spider web. |
|
The spider chart is based on standard Plot. It inherits all its properties.
 | Spider chart has no renderer. |
This is what spider chart looks like:

Dataset
The category line chart supports Custom Data model only.
It has the following Source Data Bindings:
Binding | Expected Value Type | Description |
Series | String | Textual name of the data series. Data series is represented by a single-color area (or set of lines) on the chart. |
Category | String | Name of category. Each category is represented by a radial line. |
Value | Number | Numeric value to display for the above series/category. Values are displayed along the radial lines. |
Common Properties
Width, Height, Bindings, Visible, Opaque, Background, Border
Source Data and Source Data Bindings properties.
All properties of a Plot.
Custom Properties
Web Filled
Flag that controls whether the interior of the polygon defined by the data points for each series is filled.
Property name: webFilled
Property type: Boolean
Head Percent
Size of the shapes drawn at each data point. This is a percentage of width and height of the plot area. The default value is 0.01 (one percent).
Property name: headPercent
Property type: Float
Start Angle
Angle of the first category, in degrees, relative to a radial line extending from the center of the plot horizontally to the right (that is, 3 o'clock on a clock face), in an anti-clockwise direction. The default value is 90.0 which draws the first category at the top of the plot (that is, 12 o'clock).
Property name: startAngle
Property type: Float
Max Value
Maximum value for display on the axes.
Property name: maxValue
Property type: Float
Direction
Direction in which the categories are added to the plot: Clockwise or Anticlockwise. The default is Clockwise.
Property name: direction
Property type: String
Interior Gap
Percentage between 0.0 and 0.40 (forty percent) indicating the amount of whitespace to leave around the plot (some of which is used for the labels). The default value is 0.25.
Property name: interiorGap
Property type: Float
Axis Label Gap
Gap between the end of each "radial" axis and the corresponding label, expressed as a percentage of the axis length. The default value is 0.10 (ten percent).
Property name: axisLabelGap
Property type: Float
Axis Line Paint
Paint used to draw the radial axes lines.
Property name: axisLinePaint
Property type: Data Table
Axis Line Stroke
Stroke used to draw the radial axes lines.
Property name: axisLineStroke
Property type: Data Table
Default Series Paint
Default series paint that is used if there is no custom setting for a series.
Property name: baseSeriesPaint
Property type: Data Table
Default Series Outline Paint
Default series outline paint is used to draw the outline of the shape at each data point. It is valid if there is no custom setting for a series.
Property name: baseSeriesOutlinePaint
Property type: Data Table
Default Series Outline Stroke
Default series outline stroke is used to draw the outline of the shape at each data point. It is valid if there is no custom setting for a series.
Property name: baseSeriesOutlineStroke
Property type: Data Table
Legend Item Shape
Shape used for each legend item.
Property name: legendItemShape
Property type: Data Table
Label Font
Font used to display category labels.
Property name: labelFont
Property type: Data Table
Label Paint
Paint used to display category labels.
Property name: labelPaint
Property type: Data Table
Series Paint
The table defining paints for individual data series.
Property | Name | Type | Description |
Index | index | Integer | Series index. |
Series Paint | seriesPaint | Data Table | Paint to use for the series. |
Property name: seriesPaint
Property type: Data Table
Series Outline Paint
The table defining outline paints for individual data series.
Property | Name | Type | Description |
Index | index | Integer | Series index. |
Series Outline Paint | seriesOutlinePaint | Data Table | Outline paint to use for the series shapes. |
Property name: seriesOutlinePaint
Property type: Data Table
Series Outline Stroke
The table defining outline strokes for individual data series.
Property | Name | Type | Description |
Index | index | Integer | Series index. |
Series Outline Stroke | seriesOutlineStroke | Data Table | Outline stroke to use for the series shapes. |
Property name: seriesOutlineStroke
Property type: Data Table
Common Events
Hidden, Shown, Moved, Resized, Mouse Clicked, Mouse Pressed, Mouse Released, Mouse Entered, Mouse Exited, Mouse Moved, Mouse Wheel Moved, Key Typed, Key Pressed, Key Released, Focus Gained, Focus Lost
All relevant chart events.
Additional Examples
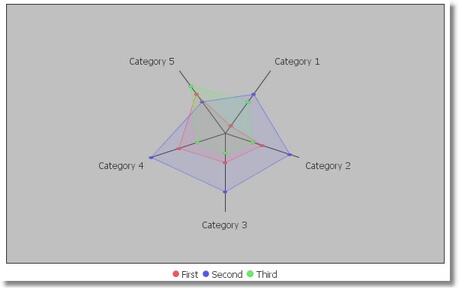
A spider chart with three data series:

Was this page helpful?
