Combined Domain XY Chart
A combined domain XY chart is a composite chart allowing two or more "simple" XY charts share a single domain axis. |
|

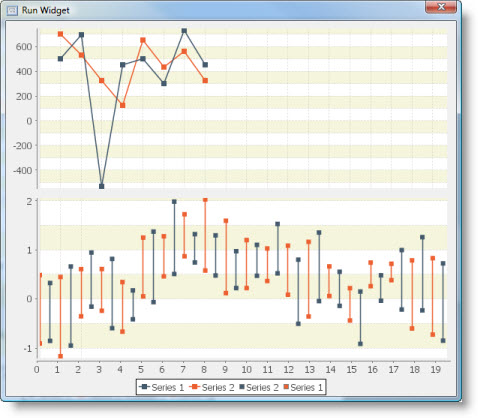
This is what combined domain XY chart looks like:
When a "simple" XY chart is added as a sub-chart to a combined domain XY chart, is has the following differences from its "standalone" version:
- No Domain Axes and Fixed Domain Axis Space properties, since Domain Axis is a part of parent XY chart.
- No Orientation property, since it inherits the orientation of parent combined chart.
- No chart common properties, since the parent XY chart has its own set of chart common properties.
- No widget component default properties, except for the Bindings property, since it is not rendered separately.
Custom Properties of Sub-Charts
Every "simple" XY chart added as a sub-chart to a combined domain XY chart has several additional properties:
Weight
The weight determines how much of the parent chart's area is assigned to this sub-chart. For example, if parent has three sub-charts with weights of 1, 2 and 4, the relative amount of space assigned to each sub-chart is 1/7, 2/7 and 4/7 (where the 7 is the sum of the individual weights).
Property name: weight
Property type: Integer
Z-Order
Sub-charts with higher order numbers are placed closer to the shared axis.
Property name: index
Property type: Integer
Common Properties
Width, Height, Bindings, Visible, Opaque, Background, Border
Domain Axes property.
Fixed Domain Axis Space property.
Custom Properties
Orientation
Chart orientation (Vertical or Horizontal). This orientation is used for all sub-charts.
Property name: orientation
Property type: String
Gap
The gap between sub-charts.
Property name: gap
Property type: Float
Common Events
Hidden, Shown, Moved, Resized, Mouse Clicked, Mouse Pressed, Mouse Released, Mouse Entered, Mouse Exited, Mouse Moved, Mouse Wheel Moved, Key Typed, Key Pressed, Key Released, Focus Gained, Focus Lost
All relevant chart events.
Additional Examples
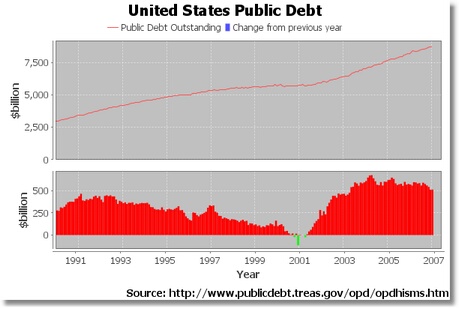
A demo showing two sub-charts sharing a common domain axis:
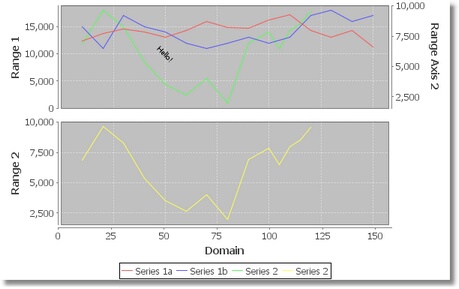
A demo showing two sub-charts that share a common domain axis. Notice also that the top plot has two range axes and a Text Annotation:
Was this page helpful?