Financial Chart
A financial chart is used to build Open-High-Low-Close (OHLC) diagrams. |
|
The financial chart is based on XY Plot and XY Renderer. It inherits all their properties.
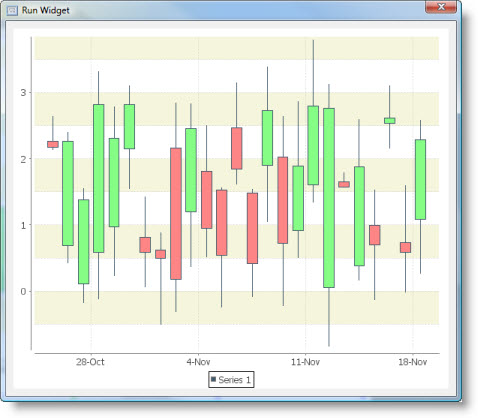
This is what financial chart looks like:

Financial chart supports two renderers:
Candlestick Renderer
A candlestick renderer draws each item from an OHLC dataset as a box with lines extending from the top and bottom. Candlestick charts are typically used to display financial data. The box represents the open and closing prices, while the lines indicate the high and low prices for a trading period (often one day).
See example of candlestick renderer on the above image.
High Low Renderer
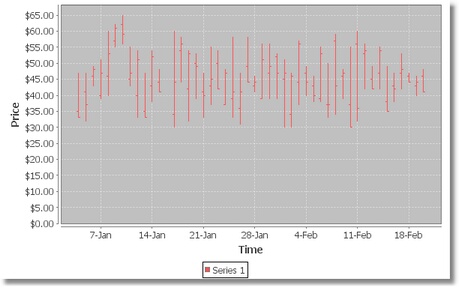
A high-low renderer draws each item in an OHLC Dataset using lines to mark the "high-low" range for a trading period, plus small marks to indicate the "open" and "close" values.

Dataset
The interval chart supports Custom Data model only.
It has the following Source Data Bindings:
Binding | Expected Value Type | Description |
Series | String | Textual name of the data series |
Date | Data | Date |
Open | Number | Open value for the date |
High | Number | High value for the date |
Low | Number | Low value for the date |
Close | Number | Close value for the date |
Common Properties
Width, Height, Bindings, Visible, Opaque, Background, Border
All Data-related properties.
All properties of a XY Plot.
All properties of a XY Renderer.
Candle Width Calculation
If the Candle Width attribute is negative, the renderer will automatically determine the candle width at drawing time.
After the candle width is calculated according to the Auto Width Method, it is then subject to three adjustments. First, the Auto Width Gap is subtracted, then the width is multiplied by the Auto Width Factor, and finally the width is capped according to the Max Candle Width In Milliseconds.
Auto Width Method
Type of candle auto width calculation:
- Average: bases the width on the default gap between consecutive x-values in the dataset
- Smallest: bases the width on the smallest gap between consecutive x-values in the dataset
This property is valid for Candlestick renderer.
Property name: autoWidthMethod
Property type: Integer
Auto Width Factor
Factor by which the candle width is multiplied during the auto-width calculation.
This property is valid for Candlestick renderer.
Property name: autoWidthFactor
Property type: Float
Auto Width Gap
Amount of space to leave on each side of every candle.
This property is valid for Candlestick renderer.
Property name: autoWidthGap
Property type: Float
Candle Width
Width of each candle. If the value is negative, then the renderer will automatically determine a width each time the chart is redrawn.
This property is valid for Candlestick renderer.
Property name: candleWidth
Property type: Float
Max Candle Width in Milliseconds
Maximum candle width in milliseconds. The default value is equivalent to 20 hours, which is a reasonable value for displaying daily data.
This property is valid for Candlestick renderer.
Property name: maxCandleWidthInMilliseconds
Property type: Float
Other Properties
up Paint
Paint used to fill candles where the closing price is higher than the opening price (that is, where the price has gone up). If this is disabled (null), the renderer will the candle using the regular series paint.
This property is valid for Candlestick renderer.
Property name: upPaint
Property type: Data Table
Down Paint
Paint used to fill candles where the closing price is lower than the opening price (that is, where the price has gone down). If this is disabled (null), the renderer will the candle using the regular series paint.
This property is valid for Candlestick renderer.
Property name: downPaint
Property type: Data Table
Use Outline Paint
This renderer can draw the outline of the candles using either the regular series paint or the series outline paint.
Use Outline Paint flag controls whether the renderer uses the series outline paint.
This property is valid for Candlestick renderer.
Property name: useOutlinePaint
Property type: Boolean
Draw Open Ticks
Flag that controls whether or not the open tick is drawn for each data value.
This property is valid for High Low renderer.
Property name: drawOpenTicks
Property type: Boolean
Draw Close Ticks
Flag that controls whether or not the close tick is drawn for each data value.
This property is valid for High Low renderer.
Property name: drawCloseTicks
Property type: Boolean
Open Tick Paint
Paint used to draw the open tick mark for each data value. If this is disabled (null) then the renderer's series paint is used instead.
This property is valid for High Low renderer.
Property name: openTickPaint
Property type: Data Table
Close Tick Paint
Paint used to draw the close tick mark for each data value. If this is disabled (null) then the renderer's series paint is used instead.
This property is valid for High Low renderer.
Property name: closeTickPaint
Property type: Data Table
Tick Length
The length of the open and close tick marks.
This property is valid for High Low renderer.
Property name: tickLength
Property type: Float
Common Events
Hidden, Shown, Moved, Resized, Mouse Clicked, Mouse Pressed, Mouse Released, Mouse Entered, Mouse Exited, Mouse Moved, Mouse Wheel Moved, Key Typed, Key Pressed, Key Released, Focus Gained, Focus Lost
All relevant chart events.
Was this page helpful?
