Building a Device Status Report
Iotellect Dashboards can be used to create custom reports to get some data in human-friendly and printable form. Your imagination is the only limit for what can be displayed in a dashboard, but this article shows how to create a report that includes the history of a certain device-generated event. We use a Virtual Device which allows us to generate arbitrary events. We assume that the Virtual Device has already been created. Our device is named virtual.
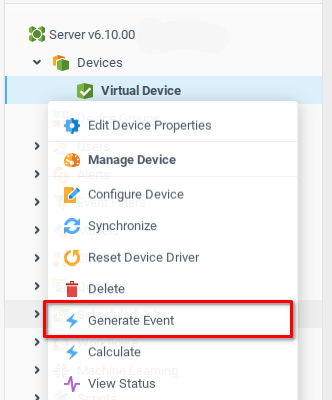
Our Virtual Device can generate arbitrary events, which we will display in our Status Report Dashboard. We will generate a few events by opening the device context menu from the System Tree and choosing the Generate Event option.
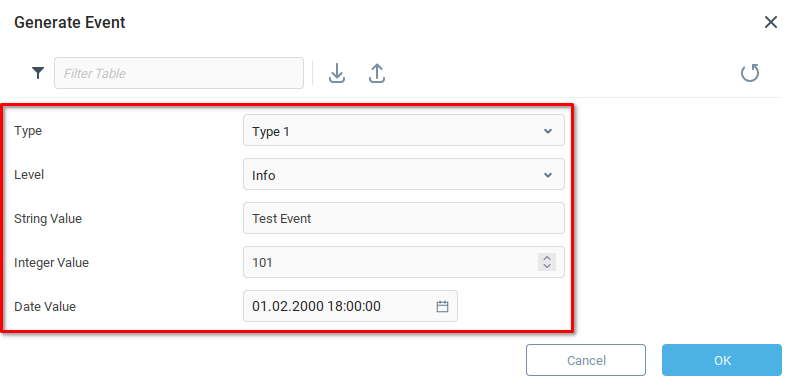
From the Generate Event dialogue, we choose values for a number of parameters, and click OK. We repeat the process a number of times to generate a few events.
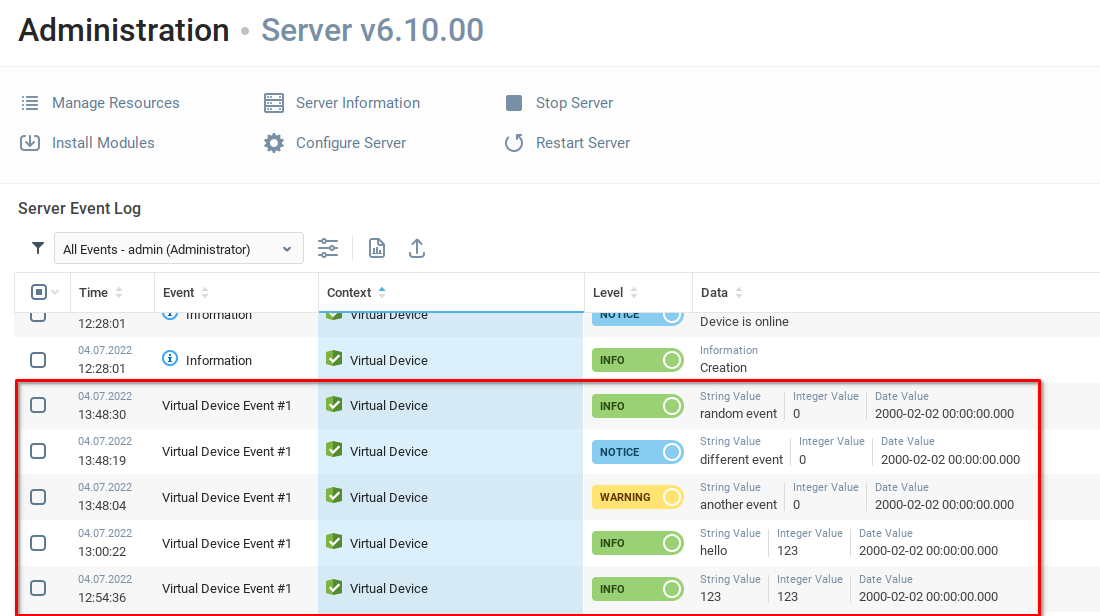
From the Server Event Log, we can see that our device has generated a number of events, with a timestamp and some additional information. Now we are ready to create a report which will display the events created by our device.
Creating a Dashboard
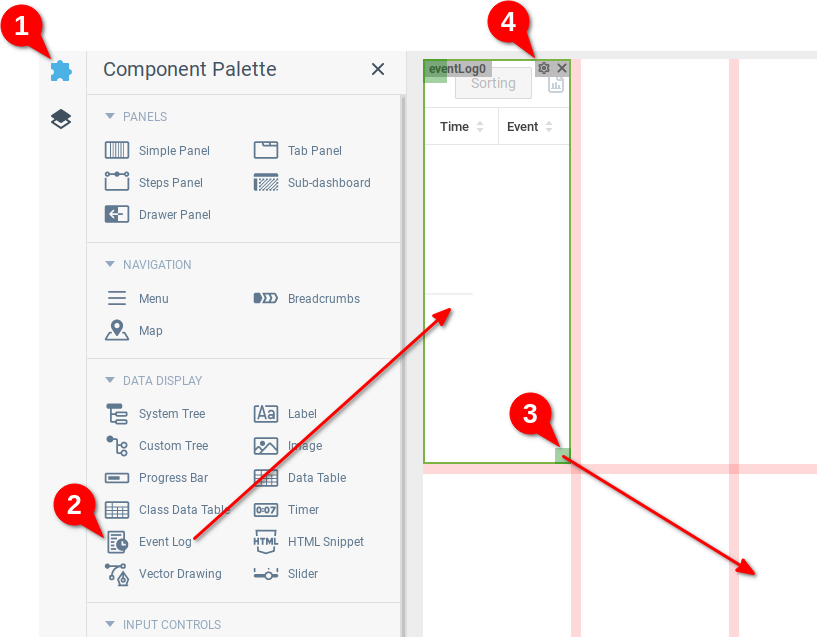
To create a new Dashboard, Select Create from the context menu of the Dashboard node of the system tree. The Creating a Dashboard to Monitor your Devices in Realtime can be helpful if you’re unfamiliar with this process. We name our dashboard errorReport and open it for editing. We select the Component Palette (1), add an Event Log component to the first grid cell (2), resize the component to an appropriate number of grid cells (3), and finally open the Component Properties window (4).
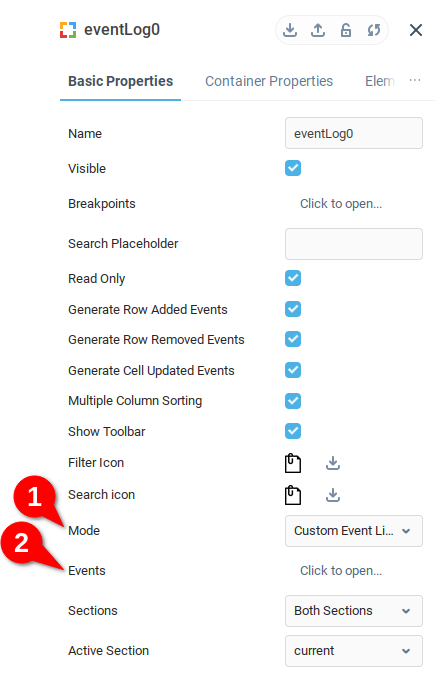
From the Component Properties menu, we have two key parameters to configure, Mode (1) which we set to Custom Event List and Events (2) which opens a further menu.
From the Events data table, we will chose a filter for the events which we would like to track on our report. We add a row (1) and select the context mask for the device which we’d like to track (2).

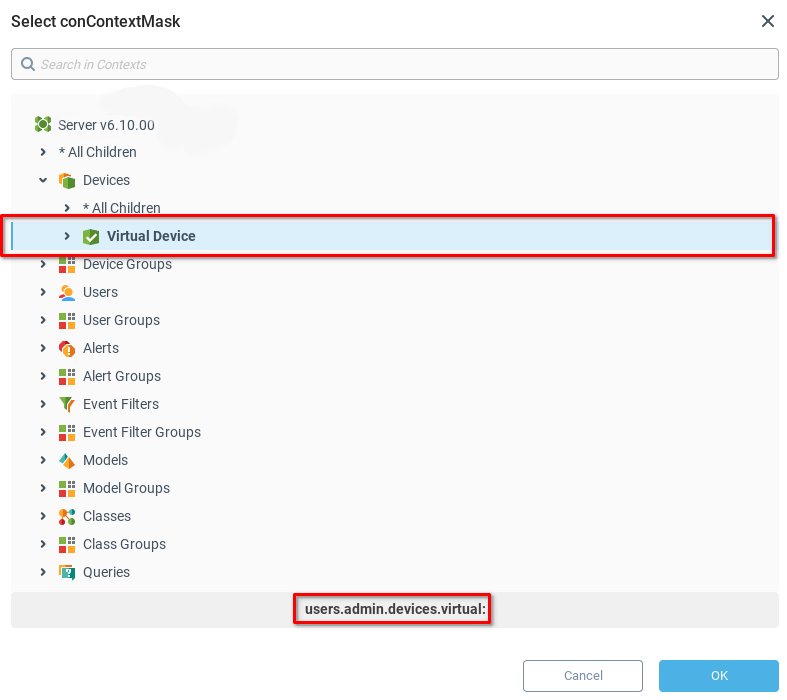
From the Context Mask menu, we select the device we would like to track. Note that the context path of the selected device is shown at the bottom of the window.
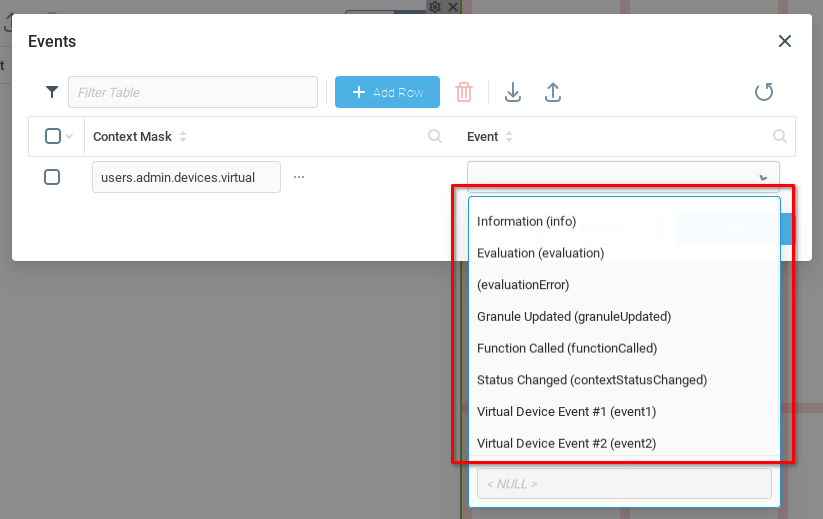
Returning to the Events dialogue, we see that the Event field drop-down has loaded the possible events which can be generated by our virtual device. We select Virtual Device Event #1 (event1) and save our changes by clicking OK.
Now that we’ve added a filter to catch the desired events, we save (1) the changes to our dashboard and open the dashboard preview (2).

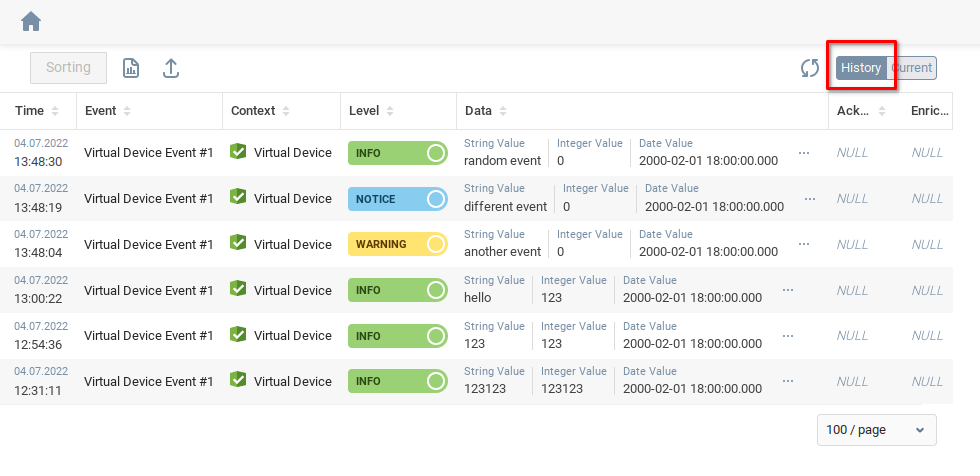
Selecting the History filter displays a record of past events which we can easily filter, search, export, and sort.
Event Charts Using Expressions and Data Tables
Although the Event Log component is very convenient for making quick charts, there are occasions when we might want to take advantage of the expression language of Iotellect to collect data from multiple devices according to a particular format. In order to display this functionality, you will need a second Virtual Device to generate events. Or second device is named virtual2.
Creating a Dashboard
We follow the same process described above for creating a dashboard, but rather than using an Event Log component, we use a Data Table component. We will collect the events generated by our two virtual devices as a data table, and send it to our component.
Creating Bindings
Having created our additional virtual device and added a Data Table component, we need to populate it with appropriate event data. We do this by creating one or more data bindings. Navigate to the Component Tree (1) and select the Root component (2) to open the Root Component Configuration. Open the Bindings tab (3) and open the Bindings data table (4).

From the Bindings menu, we add a row, and choose the Target (1) where the data should be sent and then define a Expression to extract and format the data (2).

Choosing a Binding Target
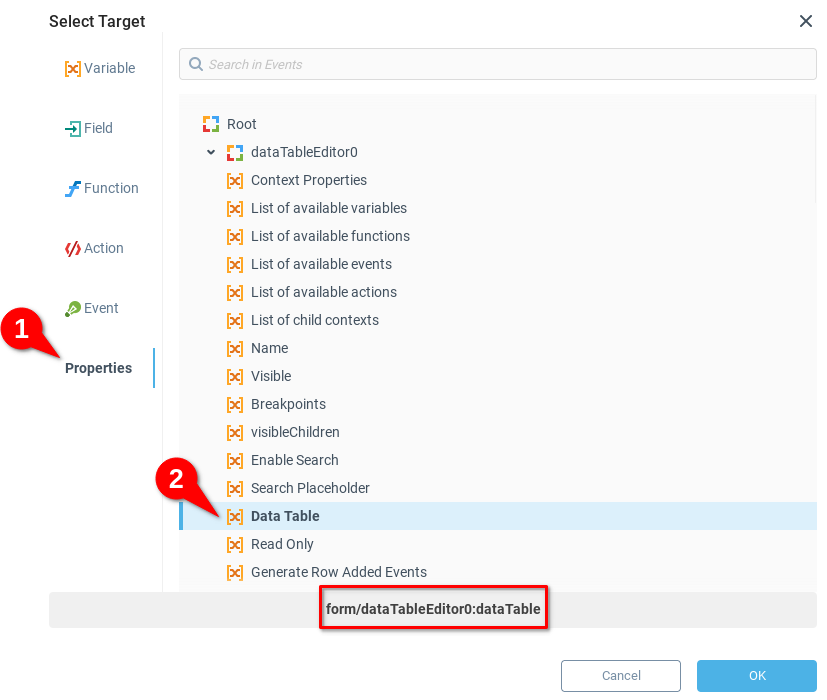
Our target in this case is straightforward, we want to send data to the Data Table component of our Dashboard. From the Select Target menu, we choose Properties tab (1) open the Data Table component and select the Data Table variable (2). This is the the variable which holds the data for our component. Note that the text path to this particular property is displayed at the bottom of the window. We save and close by clicking OK.
Creating an Expression to Extract Events
We want to capture “Virtual Device Event #1” events by either of our virtual devices. To do this we will construct an expression using the following elements:
Device Context path or mask: This is the context path leading to a specific device, or a context mask leading to a number of devices for which we’d like to retrieve events. In our case, we want to capture events from all devices, so we use the context mask
“users.admin.devices.*".Event name: The event generated by our virtual devices is
“event1".Get events function: the function
{events:get(context path,event name)}returns a data table of events based on a context path or mask and an event name.Subtable function: the function
subtable(table,field name [,field name])allows us to select certain fields from a data table and gives us a new table with only our desired rows.
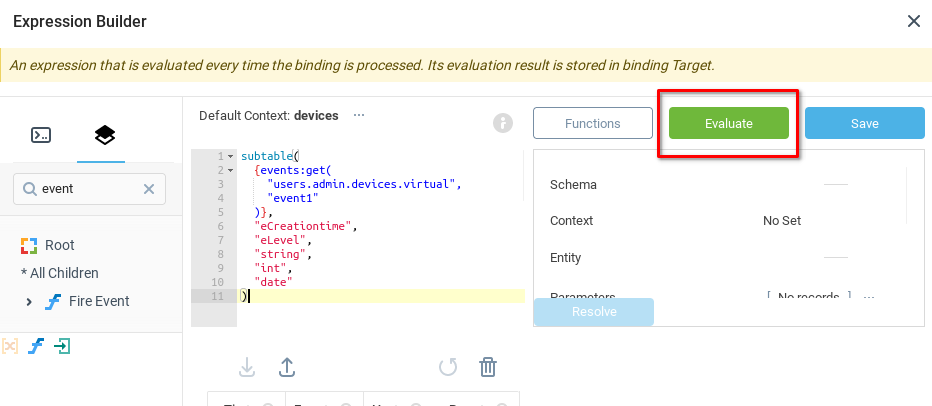
Putting these elements together, we get the following expression:
subtable( {events:get( "users.admin.devices.virtual", "event1" )}, "eCreationtime", "eLevel", "string", "int", "date" ) | Note that function parameters are enclosed into double quotes as these are simple text strings, not nested expressions. See Functions in References section for details. |
From the Expression Builder window we can choose the evaluate option to check that our expression generates the desired result.
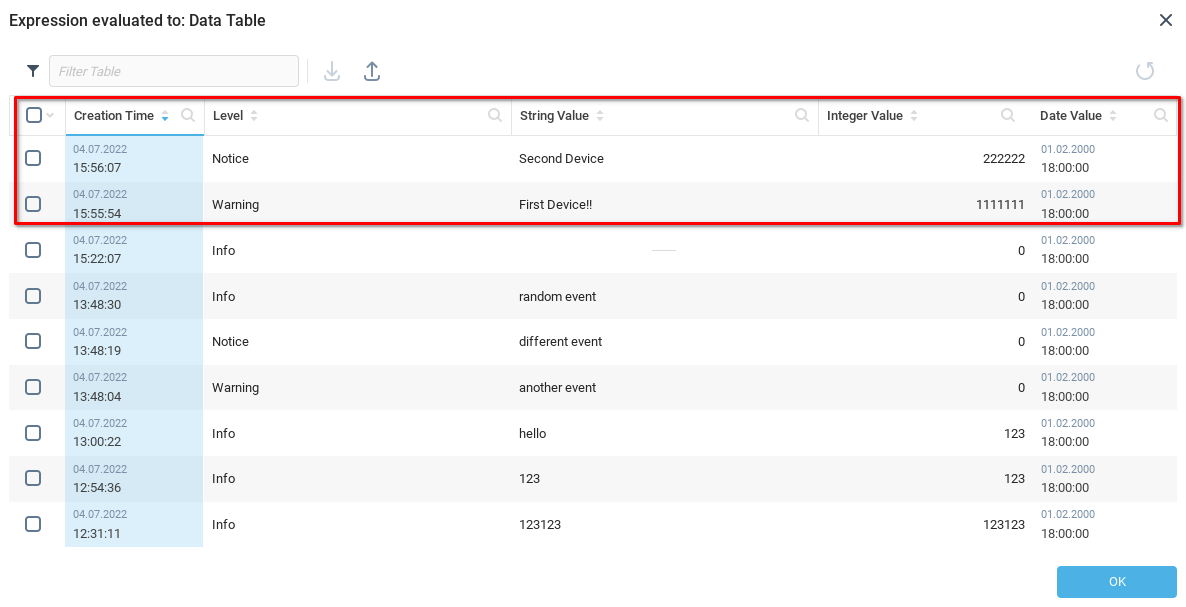
In our case, we see that the desired data table is being generated, including events which we’ve generated with both the first and second device.
We click OK to save and close the expression builder.
Choosing an Binding Activation Parameter
From the Bindings menu, we configure our binding to fire On Startup and also Periodically every one minute while the dashboard is open.

Viewing Event Report
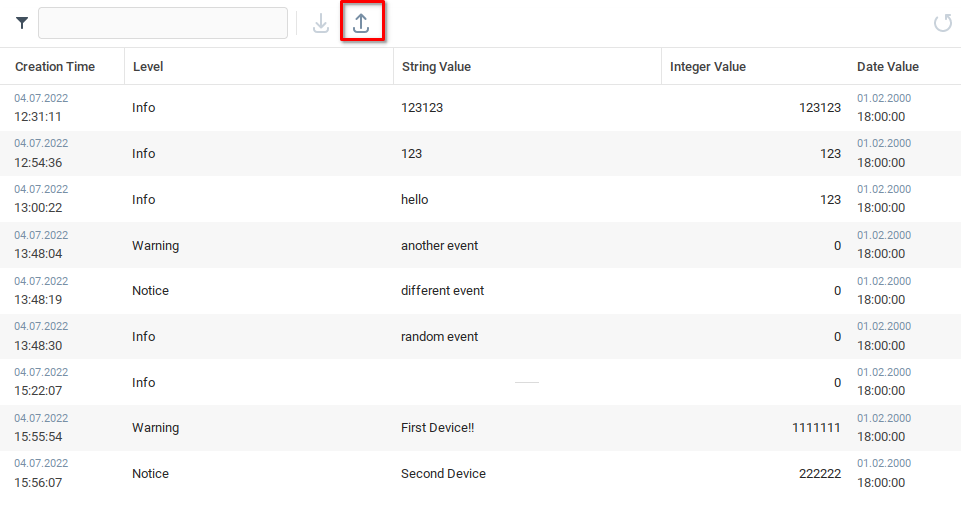
As above, we save our dashboard and open the dashboard preview. We see that our report displays events from both of our Virtual Devices, and we are able to export the report in a number of formats.
Was this page helpful?