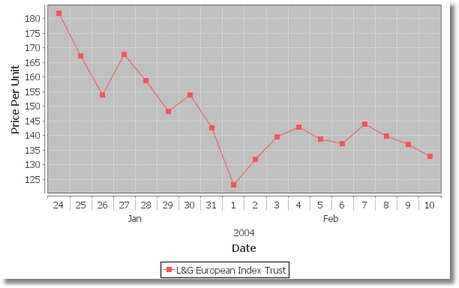
Period Axis
Period Axis is a subtype of the value axis that displays date/time values and has the following features:
- Multiple label bands, where each band is divided up into time periods;
- Automatic range calculation based on (whole unit) time periods;
- A user specified time zone.

In the above example, there are three bands. The first band is split into 1 day time periods, the second into 1 month periods, and the third into 1 year periods.
Additional properties of a period axis:
Property | Name | Type | Description |
Time Zone | timeZone | String | Time Zone that is used to "peg" time periods to the absolute time line. |
Locale | locale | String | Locale used to format timestamps into tick label strings. |
Auto Range Time Period | autoRangeTimePeriodClass | String | Time period used when the axis range is calculated automatically: Year, Month, Day, Hour, Minute, Second, or Millisecond. The axis range will always be a whole number of periods. |
Major Tick Time Period | majorTickTimePeriodClass | String | Time period used to determine the spacing of the major tick marks: Year, Month, Day, Hour, Minute, Second, or Millisecond. |
Minor Tick Time Period | minorTickTimePeriodClass | String | Time period used to determine the spacing of the minor tick marks: Year, Month, Day, Hour, Minute, Second, or Millisecond. |
Minor Tick Mark Stroke | minorTickMarkStroke | Data Table | Stroke used to draw the minor tick marks. |
Minor Tick Mark Paint | minorTickMarkPaint | Data Table | Paint used to draw the minor tick marks. |
Label Info | labelInfo | Data Table | Label band definitions, see below. |
Was this page helpful?