User Interface Development
Once the fundamental parts of a physical system have been modeled in Iotellect, you can turn your attention to developing a user interface for your application using a Web UI Dashboard.
The following part of the guide will help you explore ideas about designing and structuring dashboards.
Initial Design
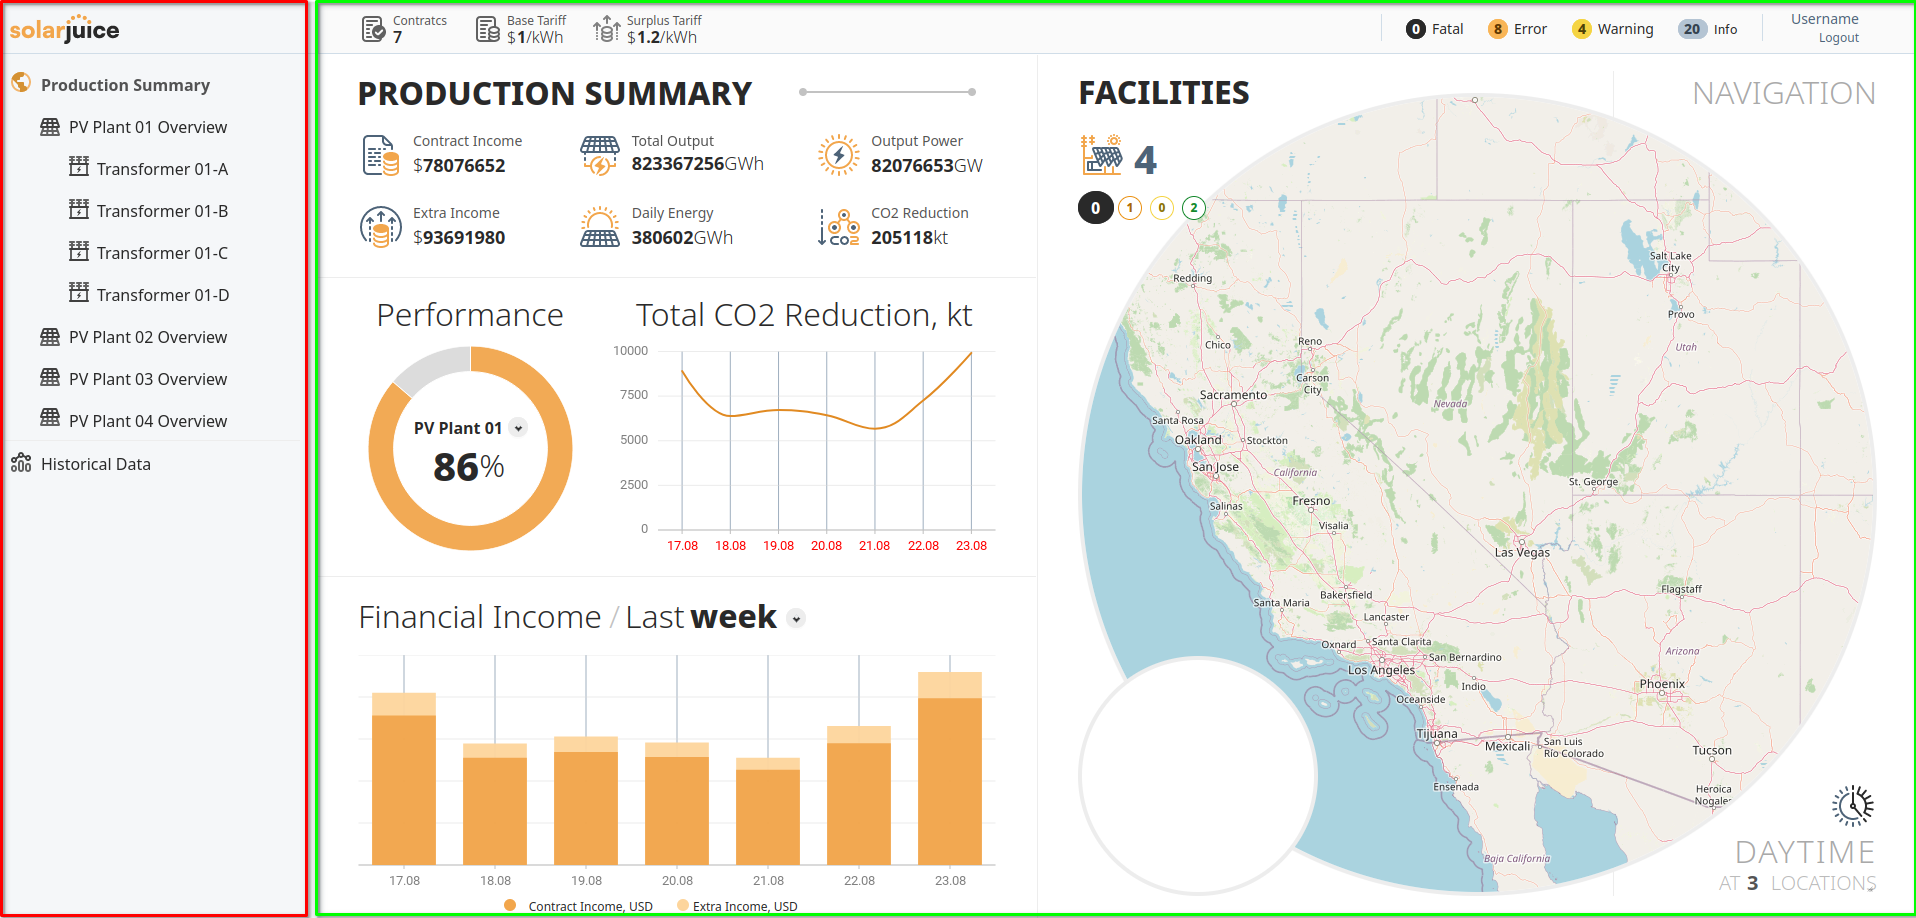
We had some conversations with a graphic designer about the power plant, indicating some of the key variables and system components that need to be available to the users. Based on the information provided, the designer created a few wire-frame models that will help guide us in developing the user interface.
Looking at the first wire-frame, we see there is a sidebar menu (red outline) and then a page (green outline) for the production overview.

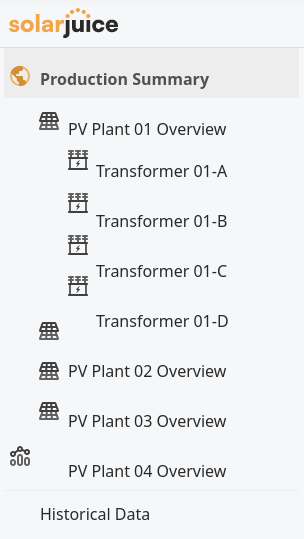
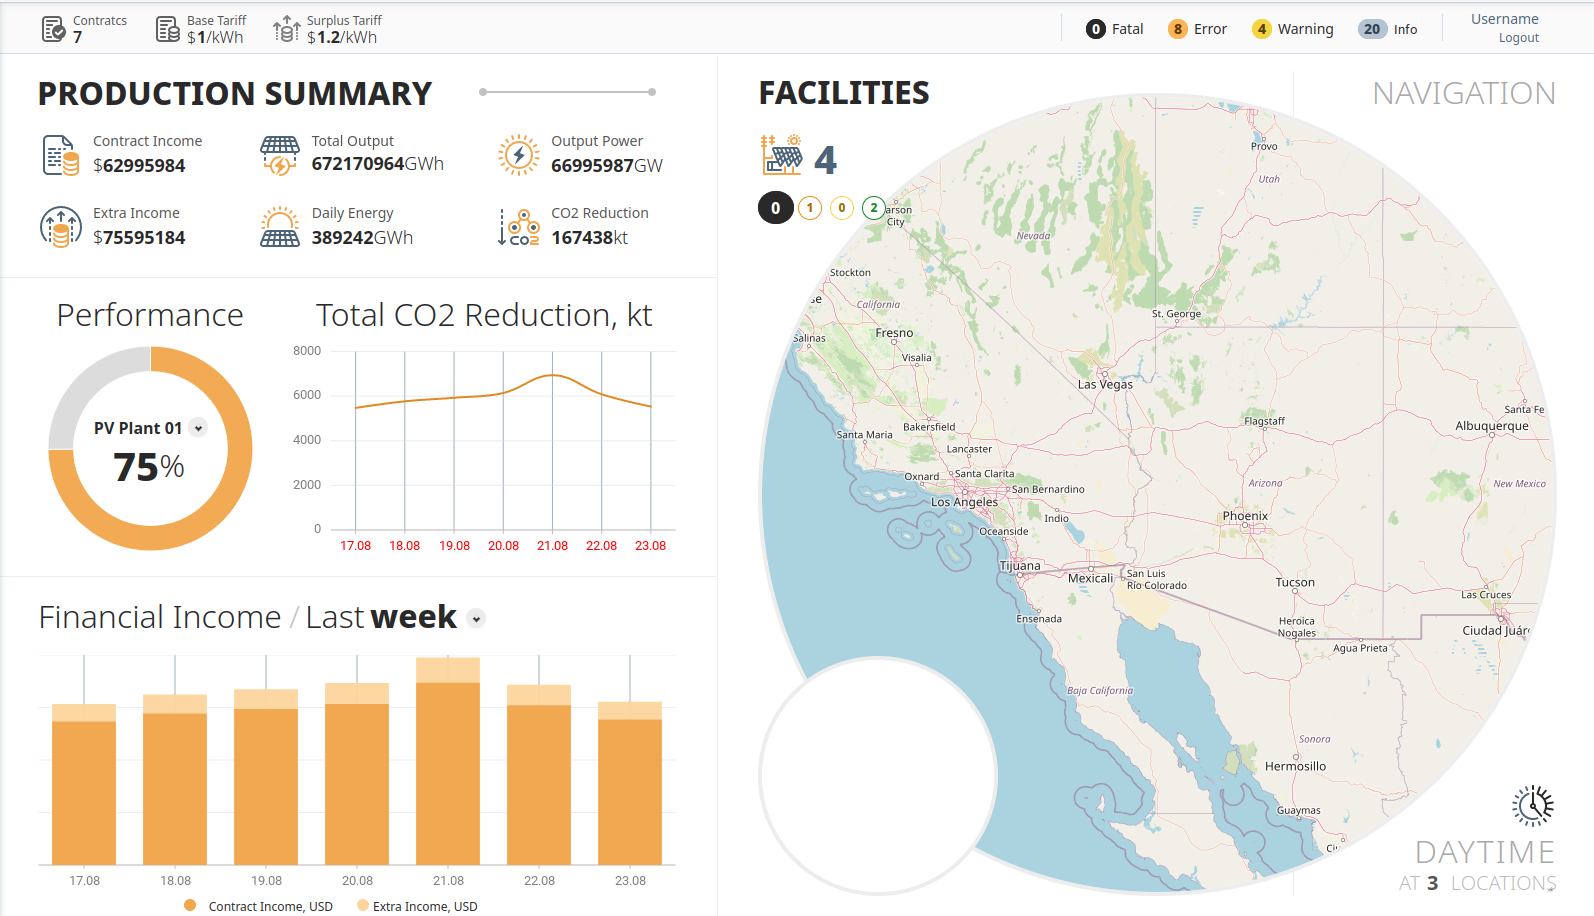
The next wire-frame has the same sidebar menu (red) and the main page displays information specific to a particular power plant (blue). The designer made the assumption that data from multiple plants might eventually be displayed on this dashboard.

The two examples above are enough to get us started on developing the dashboard prototype. The next step is to decompose the design into dashboard components.
Dashboard Breakdown
The first dashboard to create will be the header dashboard. Based on the design, there will be two parts: the side menu and a sub-dashboard where the appropriate components will be displayed based on the item selected in the menu. The initial design will contain a few items to illustrate how it works.

Production Summary
The second dashboard displays a facility map, and some key indicators expressed as values and as graphs. These parts will be assembled from the map and chart components.

Plant Overview
The third dashboard to develop will be the plant overview. Similarly to the production summary, variables are displayed as graphs, charts, and individual values. An additional component, Recent Events, is also utilized. For this dashboard, we will also explore model functions and events, and the different ways they can be activated.
Next Steps
The following chapters will expand on the topic of developing dashboard interfaces and configuring them to allow users to interact with the underlying data. You may wish to create a wire-frame design of your desired dashboard.
Was this page helpful?