Adding Device Data to Dashboards
Once you have at least one dashboard to serve as the structure for the front end of your application, and one or more devices or models holding data, the next step is configuring interactions between the dashboards and other Iotellect contexts. The following guide will show you how to retrieve data from contexts and display that data in the dashboard in a few different ways. After learning how to display data, you will learn to configure components and dashboards that allow users to take actions in contexts outside the dashboard.
Displaying a Single Field of Data
Any data stored or accessible by a context in Iotellect can potentially be accessed or manipulated by a dashboard. Security is provided by the Permissions Table, which determines the contexts a given user can access. The following example deals with a dashboard being accessed by the admin user, therefore no specific permissions are required.
Organizing Components
Based on the design provided in the section Planning and High Level Design, we see a section Meteo Data with a number of fields, including Local Time and Illuminance. The variable Time will be calculated using an expression language function, and Illuminance will be provided by the Weather Data variable which exists in the Additional Data model.
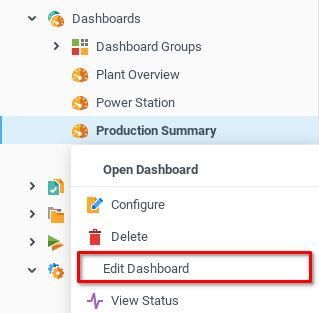
First, open the Production Summary dashboard for editing.
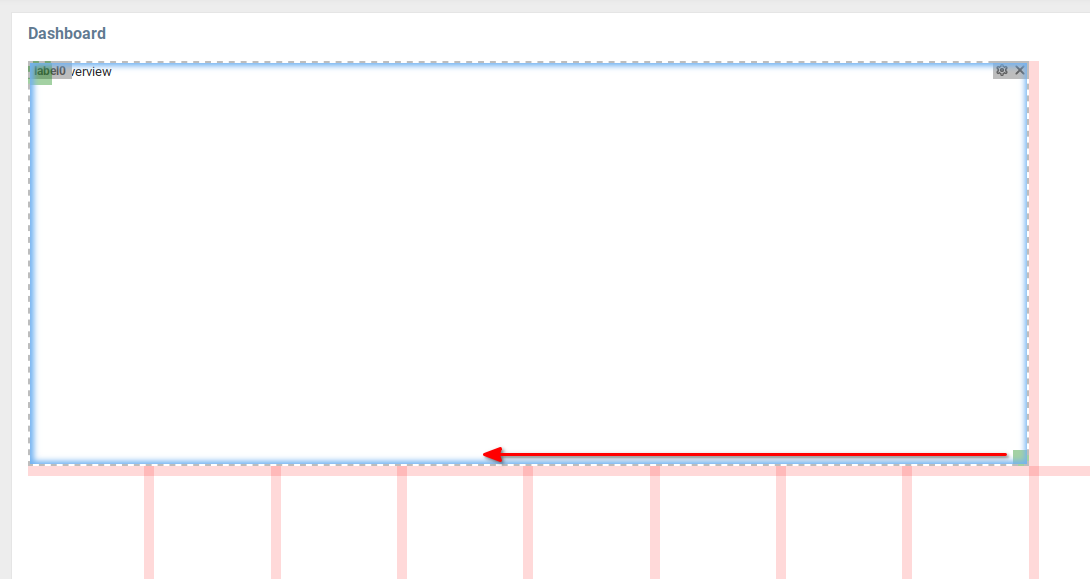
The current design has one label, covering the whole top row of the dashboard grid. Resize it to take up a little less space.
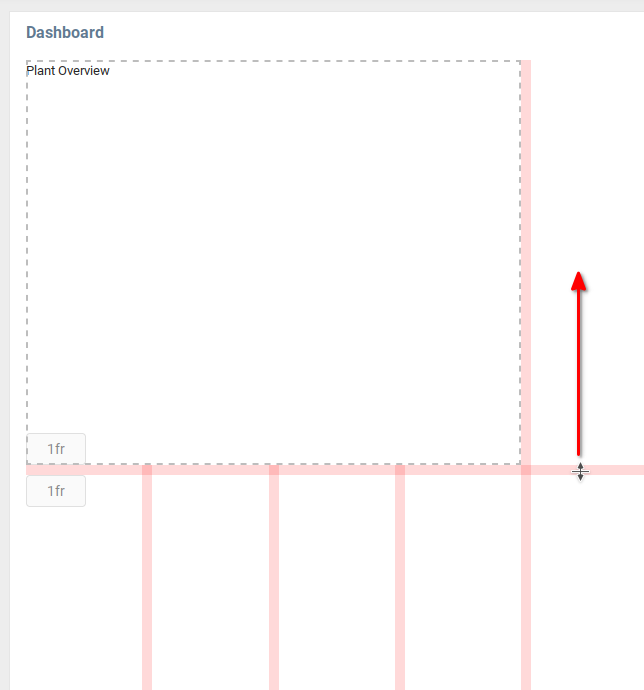
The Meteo Data section will need more vertical space than the plant overview. To resize the grid, click the center line and drag it up to change the scale of the grid.
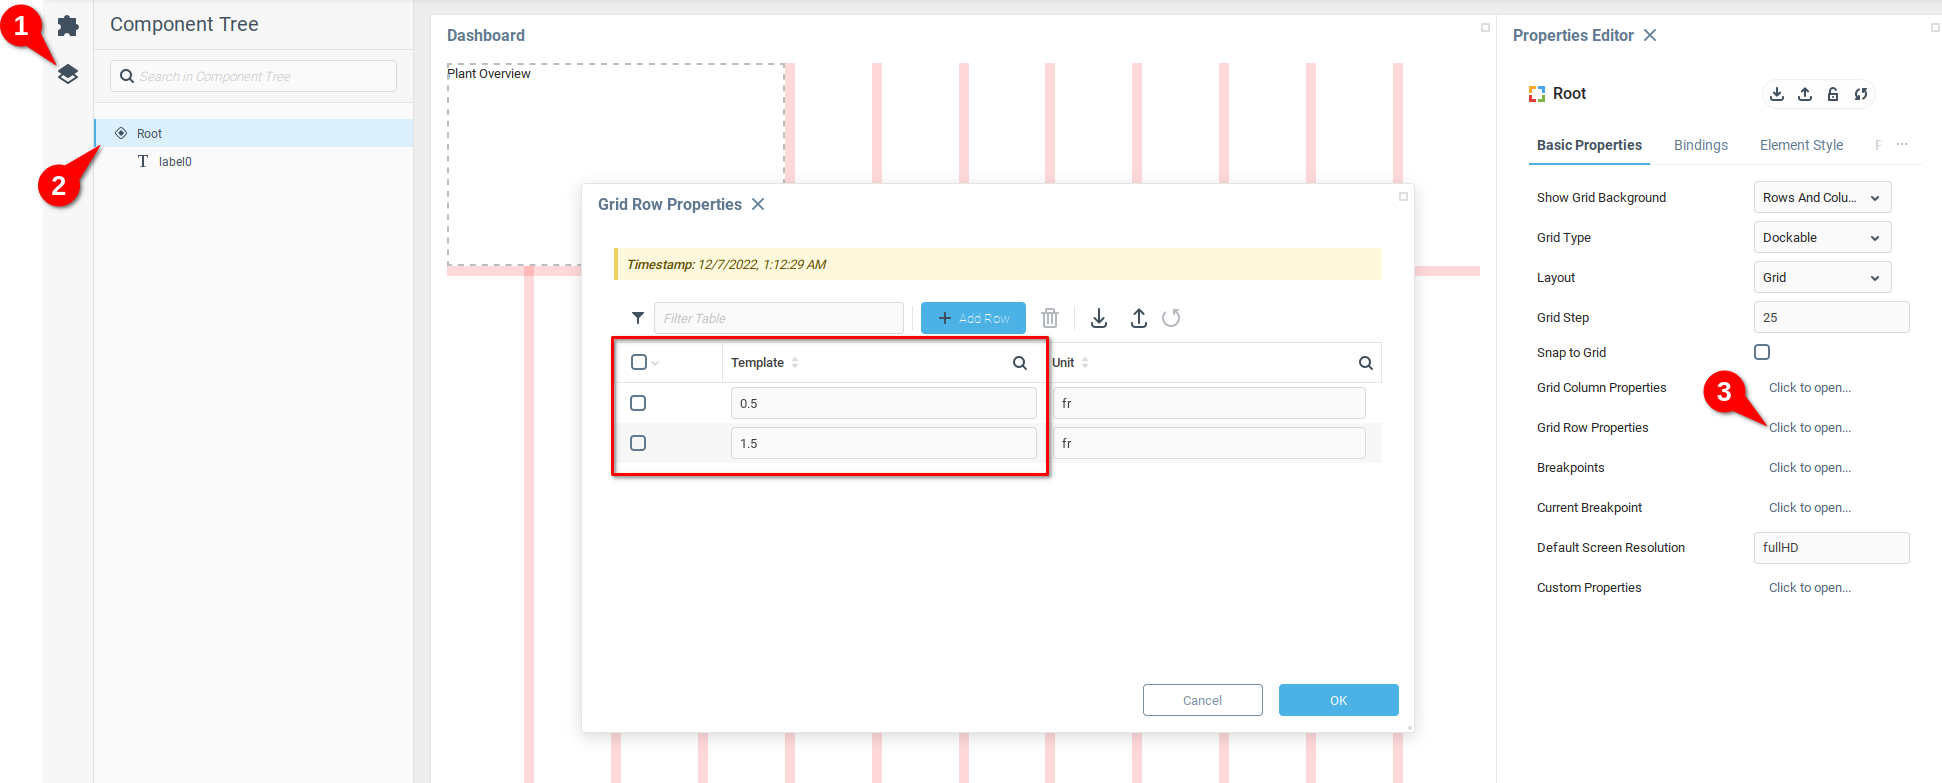
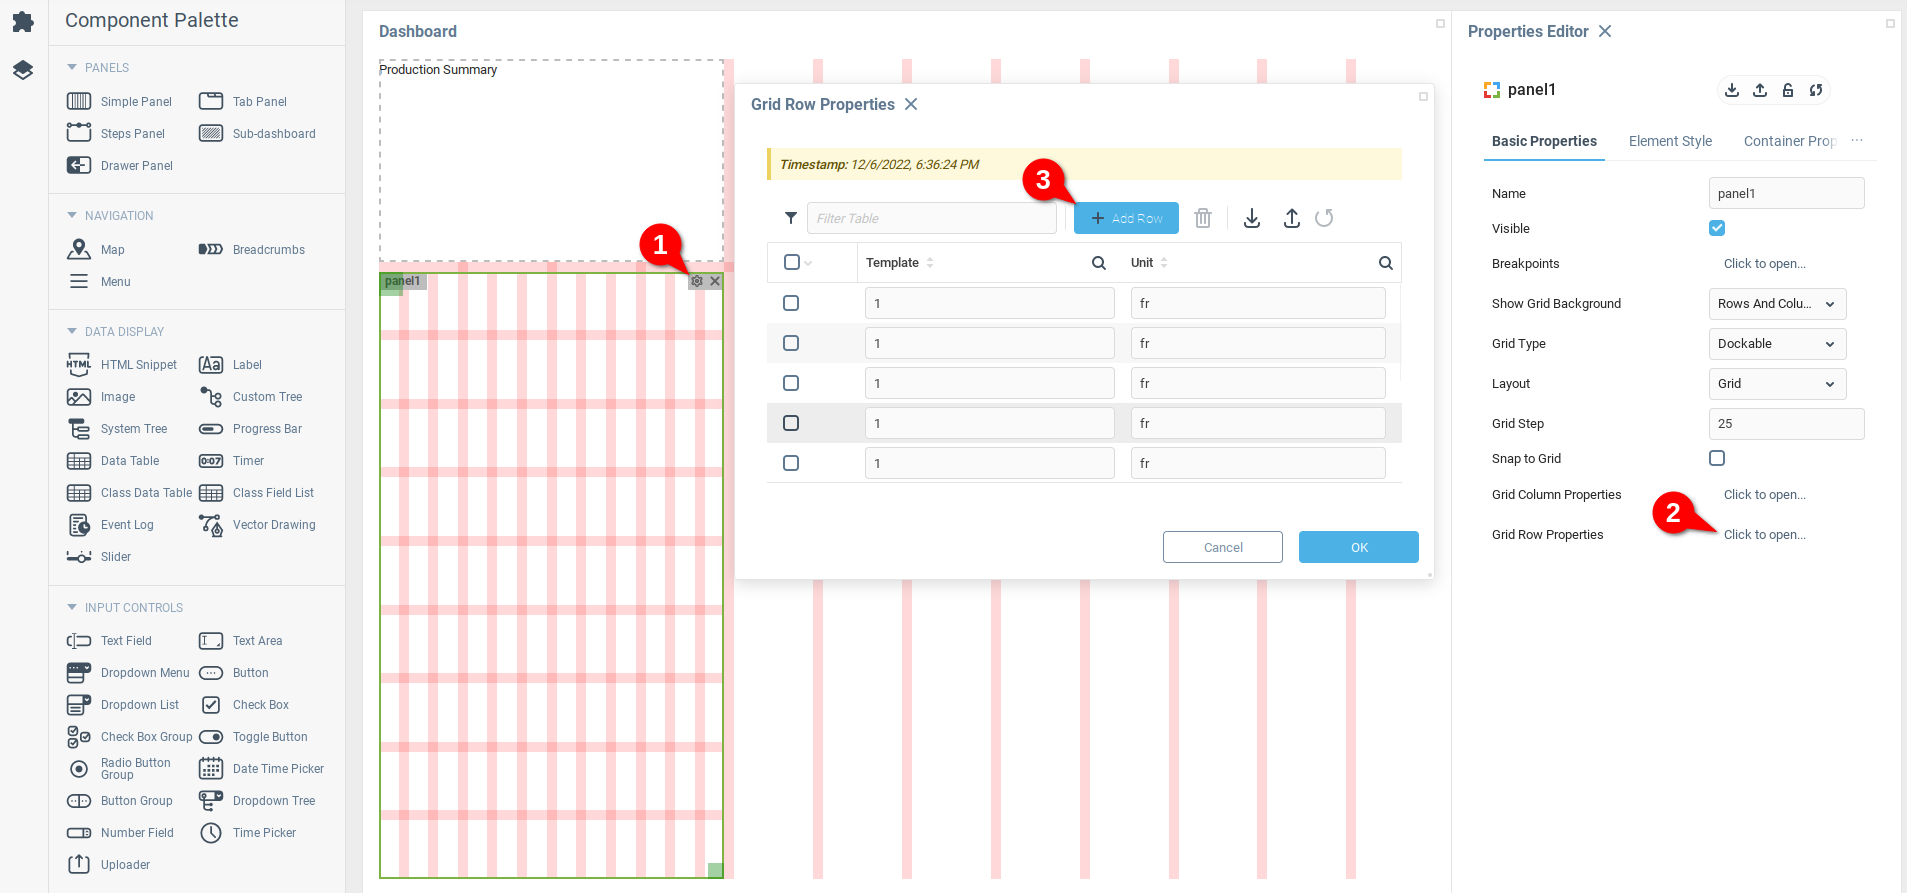
You can add additional grid divisions through the Grid Row Properties and Grid Column Properties of the Root component of the dashboard. This property can be accessed by opening the Component Palette (1), selecting the Root component (2) and then opening the Grid Row Properties property (3). In the Template field highlighted below, you can see that the proportion between grids has been changed.
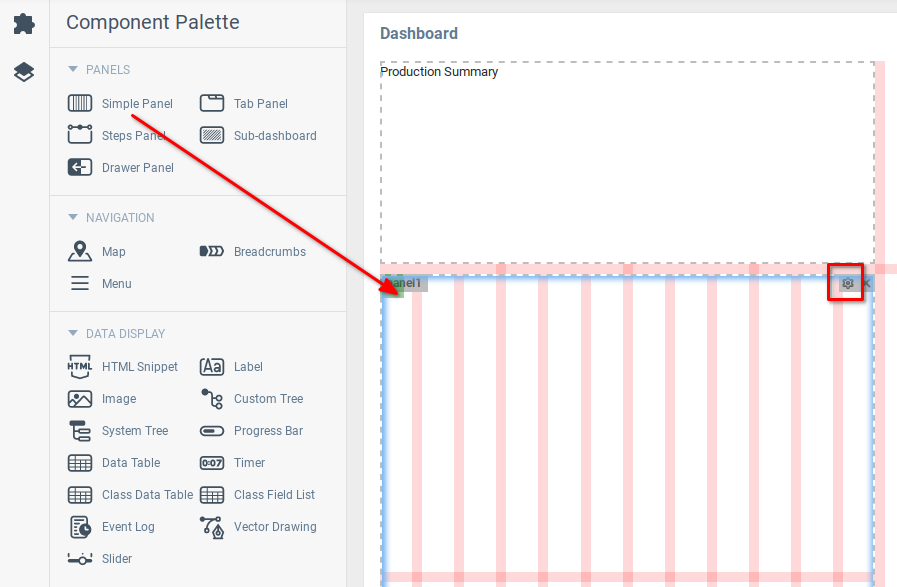
Now that you have a bit more grid space to work with, add a Simple Panel component, expand it to take up the whole area under the dashboard title. Open the settings for the component by clicking the gear icon.
There are enough columns in the Simple Panel component, but it would be good to have a few more rows in the grid to simplify organizing the components. From the properties editor of the Simple Panel component (1) open the Grid Row Properties property (2) and add another eight rows (3). You can see that now the Simple Panel component has more rows.
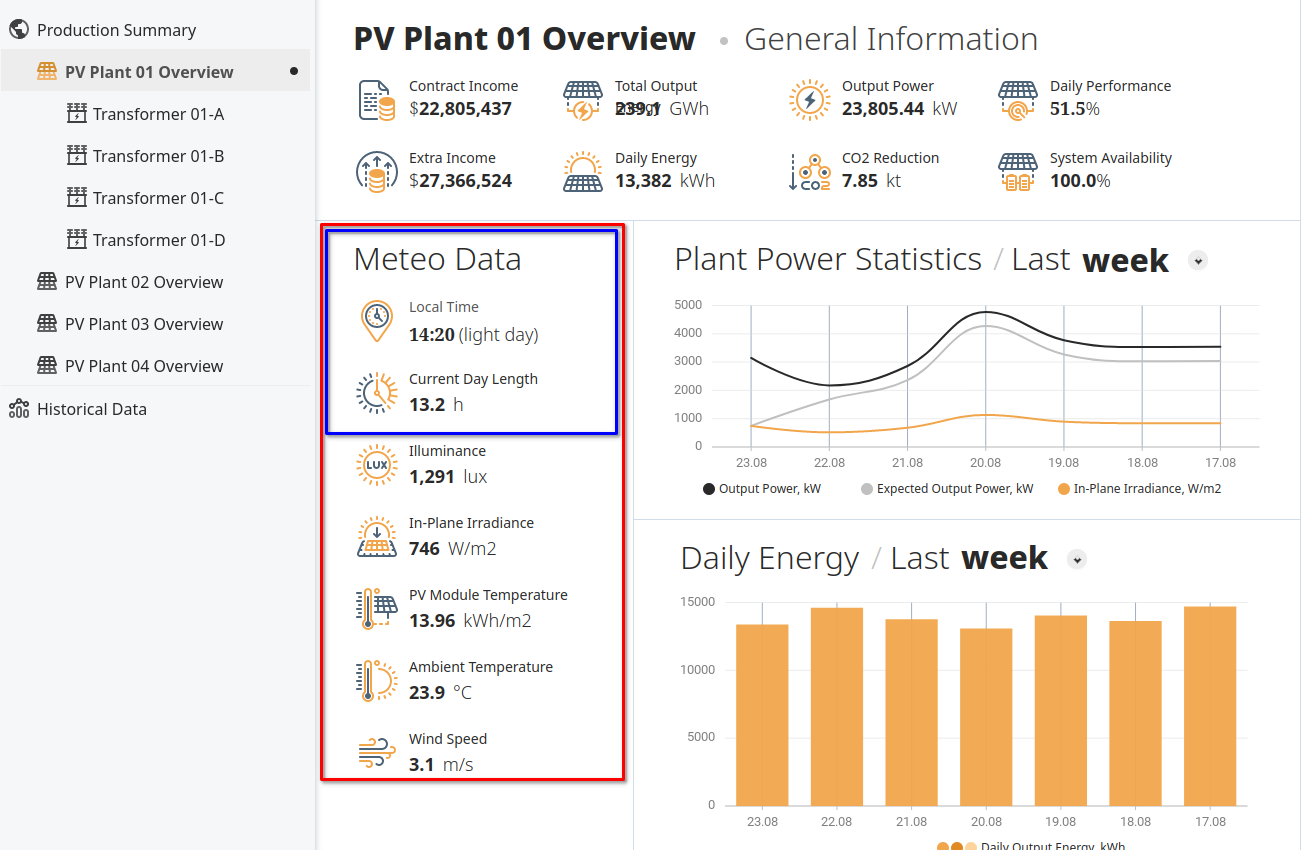
Recalling the design for the Meteo Data element, seen below and highlighted in red, we will start by creating the title and first two elements, highlighted in blue.
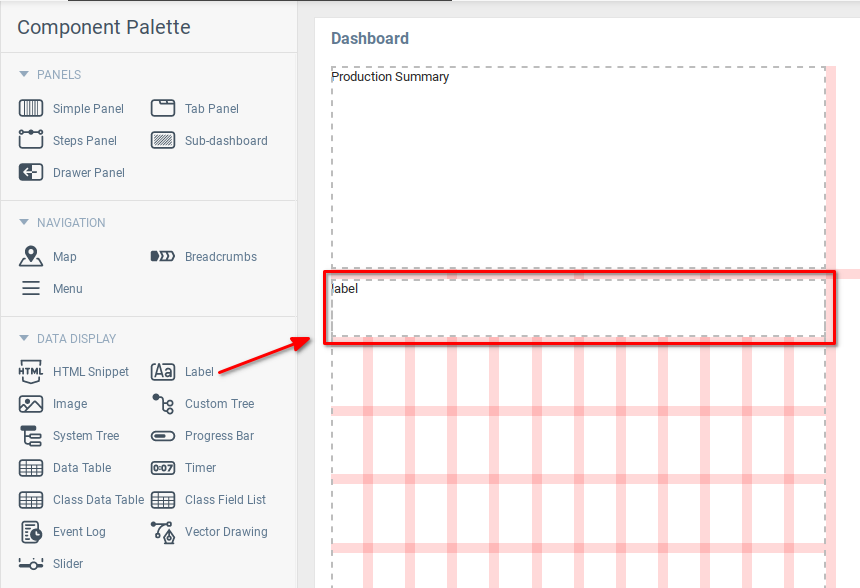
In the dashboard editor, the Simple Panel component panel0 will serve as the container for the Meteo Data. First, add a label component at the top for the title and scale it to cover the whole top row of grid space.
For the first row of data, add an image component to hold the icon and two label components.
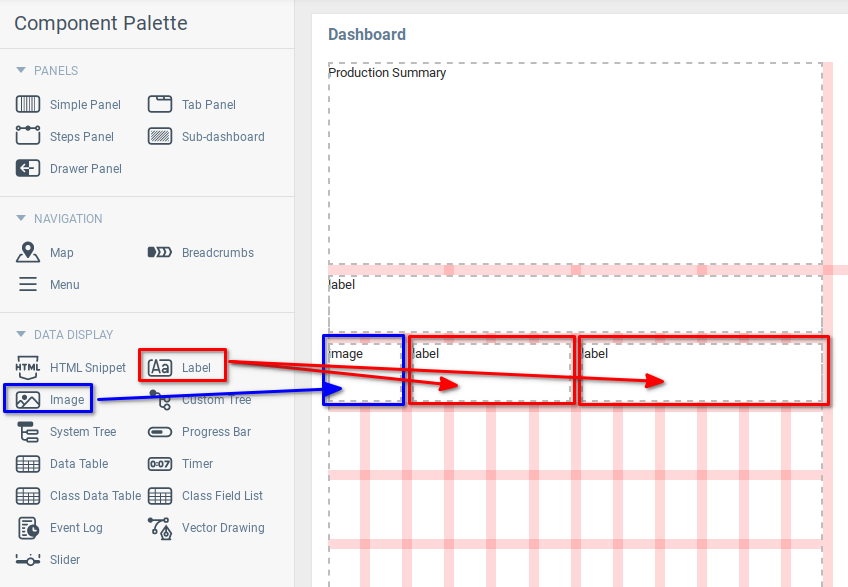
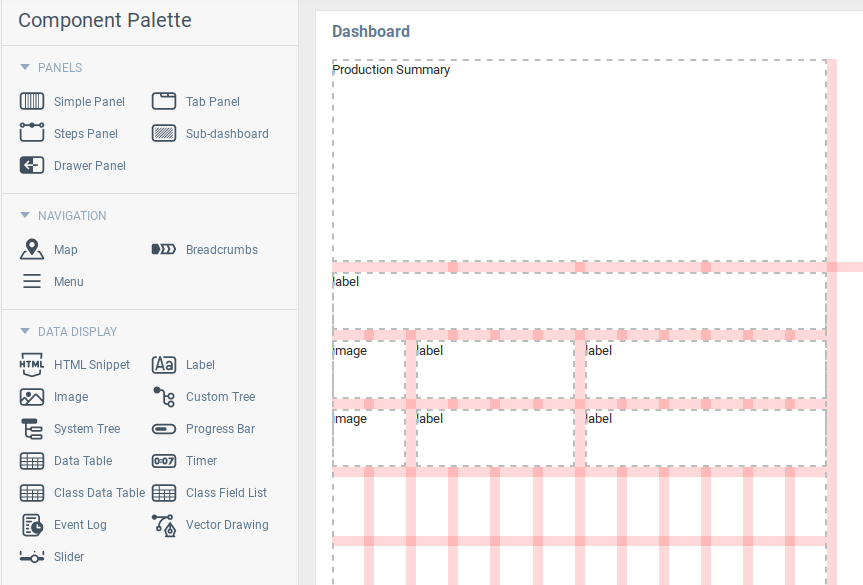
Add at least one more row with an image and two labels.
If you are using Source Control, this may be an appropriate time to save your dashboard, ensure that the desired dashboard contexts are included in your application, export and commit the changes to your version control system.
Set Static Values for Labels
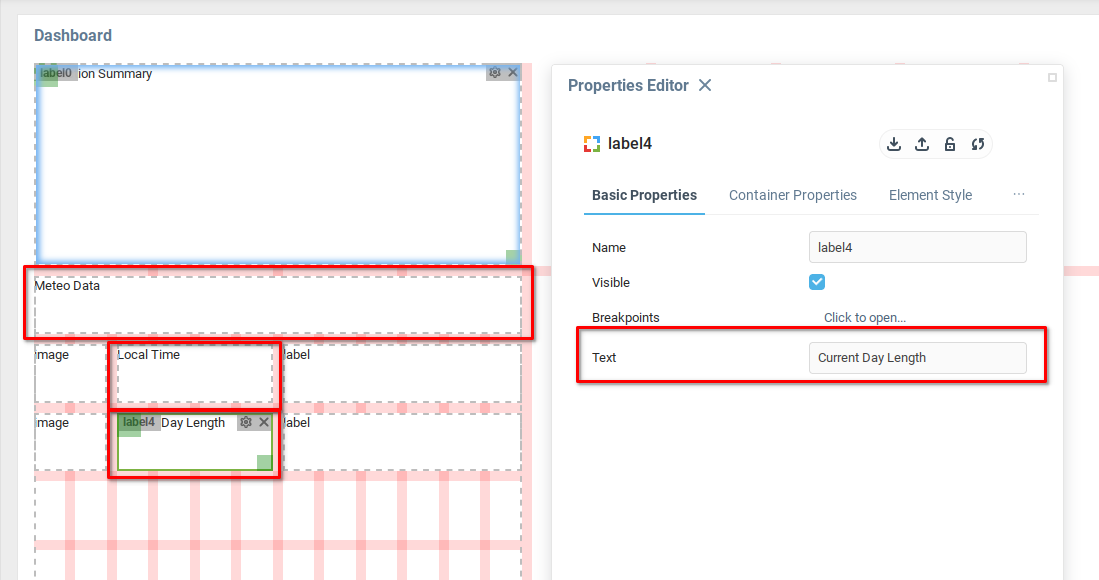
Three of the labels will hold static data, which will describe the variables. Their text will be Meteo Data, Local Time, and Current Day Length. Enter these values into the Text property of the Properties Editor.
Add Icons
The Image component can display a number of different image types. The example uses the following SVG images for the Local Time and the Current Day Length parts of the description.
To create the above image, enter the below text into a file with the .svg extension, for example Local_Time.svg
<svg id="ic_local_time_48" xmlns="http://www.w3.org/2000/svg" width="48" height="48" viewBox="0 0 48 48"> <rect id="backplate" width="48" height="48" fill="none"/> <g id="icon"> <path id="color_02" d="M24,5A14,14,0,0,1,35.585,26.857L24.551,42.712a.671.671,0,0,1-1.1,0L12.426,26.873A14,14,0,0,1,24,5m0-2A16,16,0,0,0,10.773,28L21.808,43.855a2.671,2.671,0,0,0,4.384,0L37.227,28A16,16,0,0,0,24,3M16,18a1,1,0,1,0,1,1,1,1,0,0,0-1-1m1-4a1,1,0,1,0,1,1,1,1,0,0,0-1-1m14,0a1,1,0,1,0,1,1,1,1,0,0,0-1-1M17,22a1,1,0,1,0,1,1,1,1,0,0,0-1-1m3-11a1,1,0,1,0,1,1,1,1,0,0,0-1-1m8,0a1,1,0,1,0,1,1,1,1,0,0,0-1-1M20,25a1,1,0,1,0,1,1,1,1,0,0,0-1-1m4,1a1,1,0,1,0,1,1,1,1,0,0,0-1-1m8-8a1,1,0,1,0,1,1,1,1,0,0,0-1-1" fill="#f2a64c"/> <path id="color_01" d="M24,9A10,10,0,1,1,14,19,10.011,10.011,0,0,1,24,9m0-2A12,12,0,1,0,36,19,12,12,0,0,0,24,7m5.707,16.293L26.7,20.286a2.964,2.964,0,0,0-1.7-4.1V12a1,1,0,0,0-2,0v4.184A2.991,2.991,0,1,0,25.286,21.7l3.007,3.007a1,1,0,0,0,1.414-1.414M23,19a1,1,0,1,1,1,1,1,1,0,0,1-1-1" fill="#4d6378"/> </g></svg>Similarly, the Current Day Length image can be created with the following text:
<svg id="ic_day_lenght_48" xmlns="http://www.w3.org/2000/svg" width="48" height="48" viewBox="0 0 48 48"> <rect id="backplate" width="48" height="48" fill="none"/> <g id="icon"> <path id="color_02" d="M24,3a1,1,0,0,0-1,1V7a1,1,0,0,0,2,0V4a1,1,0,0,0-1-1M37.622,38.678l-1.929-2.3a1,1,0,0,0-1.532,1.286l1.929,2.3a1,1,0,0,0,1.532-1.286m-4.5-5.361-6.546-7.8A2.962,2.962,0,0,0,25,21.184V11a1,1,0,0,0-2,0V21.184A2.99,2.99,0,1,0,25.045,26.8l6.544,7.8a1,1,0,0,0,1.532-1.286M23,24a1,1,0,1,1,1,1,1,1,0,0,1-1-1m21.681,3.647a1,1,0,0,1-.984.826,1.043,1.043,0,0,1-.175-.015l-5.955-1.05a13.991,13.991,0,0,1-.971,2.708l5.224,3.018a1,1,0,1,1-1,1.732l-6.059-3.5A1,1,0,0,1,34.4,30,12.009,12.009,0,0,0,28.1,12.72a1,1,0,0,1-.6-1.281L29.9,4.864a1,1,0,0,1,1.879.684L29.715,11.22a13.855,13.855,0,0,1,2.49,1.447l3.885-4.63a1,1,0,1,1,1.532,1.285l-3.888,4.633a14.13,14.13,0,0,1,1.845,2.2l5.241-3.026a1,1,0,1,1,1,1.732l-5.239,3.025a14,14,0,0,1,.986,2.7l5.955-1.05a1,1,0,1,1,.348,1.97l-5.954,1.05A13.706,13.706,0,0,1,38,24a14.083,14.083,0,0,1-.082,1.439l5.952,1.049a1,1,0,0,1,.811,1.159" fill="#f2a64c"/> <path id="color_01" d="M25,41v3a1,1,0,0,1-2,0V41a1,1,0,0,1,2,0m6.78,1.452-1.026-2.819a1,1,0,0,0-1.88.683l1.026,2.82a1,1,0,1,0,1.88-.684M19.125,7.684,18.1,4.864a1,1,0,0,0-1.88.684l1.026,2.819a1,1,0,1,0,1.88-.683m-5.286,2.65-1.929-2.3a1,1,0,0,0-1.532,1.286l1.928,2.3a1,1,0,1,0,1.533-1.286m-4.062,4.3-2.6-1.5a1,1,0,0,0-1,1.732l2.6,1.5a1,1,0,1,0,1-1.732M7.432,20.063l-2.955-.521a1,1,0,0,0-.347,1.97l2.954.521a1,1,0,0,0,1.159-.811,1.052,1.052,0,0,0,.015-.175,1,1,0,0,0-.826-.984m.811,6.715a1,1,0,0,0-1.159-.811l-2.954.521a1,1,0,0,0,.347,1.97l2.955-.521a1,1,0,0,0,.826-.984,1.043,1.043,0,0,0-.015-.175M10.143,32a1,1,0,0,0-1.366-.366l-2.6,1.5a1,1,0,0,0,1,1.732l2.6-1.5A1,1,0,0,0,10.143,32m3.573,4.257a1,1,0,0,0-1.41.123l-1.928,2.3a1,1,0,1,0,1.532,1.286l1.929-2.3a1,1,0,0,0-.123-1.409m4.811,2.778a1,1,0,0,0-1.282.6l-1.026,2.819a1,1,0,0,0,1.88.684l1.026-2.82a1,1,0,0,0-.6-1.281m10.261-1.876A1,1,0,1,0,28.1,35.28a12,12,0,0,1-8.217-22.557,1,1,0,0,0-.686-1.879,14,14,0,0,0,9.587,26.315" fill="#4d6378"/> </g></svg>Open the Properties Editor for each Image component, and upload an image to the Image property (1).
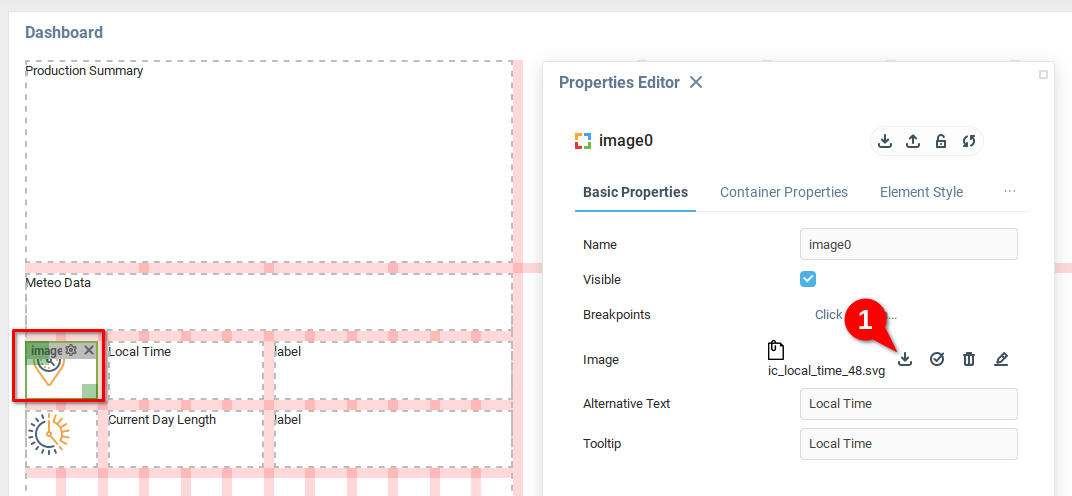
Having uploaded the images and changed the labels, check that everything is working correctly by opening the Power Station dashboard. We can see the different components of the dashboard coming together.

Styling the components will come in the next chapter. Now, we will consider dynamically adding data to the dashboard.
Adding Dynamic Values
Now that there are some components in place, we will expand the use of bindings. The Power Station dashboard used a single binding to move between sub-dashboards. We will use bindings to provide some data to the components.
The first component we want to update is the Label, which will display the local time. The component can be referenced according to its Name in the Properties Editor. The example label in this case is named label3.

Hovering over the property we want to update opens a tool tip window, indicating the property name. In the example below, the property to update has the field name text.

Now open the Bindings property. This can be found by opening the Component Tree (1) selecting the Root component (2). Select the Bindings tab (3) in the Properties Editor of the Root component, and then the Bindings table (4).

Add another binding to the table with the Add Row button.

The fields we need to modify in our example are Target, Expression, On Startup, and Periodically, and are discussed in detail below.
Target
From the previous steps, you have determined the name (label3) and the property (text) to update with the local time. Open the Select Target dialogue and navigate to the Properties item (1), open the label3 property (2) and select the Text variable (3). At the bottom (4) the reference string is displayed. Referencing dashboard components follows the pattern form/<component name>:<component property>. The reference in the example is form/label3:text.

Expression
When the expression is evaluated, the result will be sent to the Text property of the Label component. The label component documentation indicates that the value of the Text field must be a String. Although Iotellect can often determine the correct type conversion when there is a type mismatch (for example, if a function assigns an Integer to a variable with String type) it is generally best practice to write expressions that evaluate to a result with the correct data type for the target.
In the example, we update the label with the current time, but the value needs to be expressed as a String data type. The following uses functions from the date/time processing category.
We can find the current time with the function now(). This will produce a Date type, including the second, minute, hour, day, month, year, and day of the week.
The function hour(Date date) extracts the current hour and minute(Date date) extracts the current minute, both as Integers. Using the string(Object value) function, we can convert both of the Integers to Strings.
Now we have two functions string(hour(now())) giving the current hour as a String, and string(minute(now())) giving the current minute as a String. The + operator allows strings to be concatenated. To bring everything together, you can construct the following expression:
string(hour(now())) + ":" + string(minute(now()))

on Startup
This checkbox determines whether to execute the binding at the moment the dashboard is opened. Check True to cause the time string to be loaded into the label when the dashboard opens.
Periodically
This checkbox determines whether to execute the binding periodically at the specified interval. Users might look at the dashboard for more than a minute. Check True to cause the time string to be loaded into the label at each interval specified in the Period field.
Period
The Expression constructed above produces the hour and minute, so an updated period is appropriate.

Opening the Power Station dashboard now gives us the current time.

To explore this topic further, consider the following questions:
The
hour(Date date, [String timezone])has a second, optional argument. If the power station was being monitored in a different time zone, how could you display a different time zone?The
string(minute(now()))function produces1,2,3and so on, without a leading0. If the time is17:05the expression will produce the string"17:5". How to change the expression in order to correctly express the time when the minute is less than10?
Adding Data from a Model
Now that you have an understanding of using the expression language to produce and format data, consider the case of the model Additional Data, created in the chapter Implementing Data Models. There is a Weather variable, but no Current Day Length field. Add this field, creating it with the following values:
Name:
daylengthType:
FloatDescription:
Day Length, hours

Now that the variable exists, you will need to add some data to the model. Open the Edit Additional Properties context menu item.

Unlock the variables for editing (1) and open Weather Data (2).

Add some data to the table. The result should be similar to the below. Click OK to save and close.

Return to the Production Summary dashboard and open the Bindings table. Add a new row (1), and add a target to the label where you want to display the Day Length variable (2). In the below example, the name is label5, so the reference to the text property is form/label5:text. Open the expression builder (3) for the binding.

The expression builder contains several panes. First, open the Entity Selector (1). In order to retrieve the weather data from the model, we need to reference it in the binding expression. Since you know the name of the model, you can search for contexts matching the word “additional” (2).
You will see the System Tree will show a filtered list of contexts. Open the Models context (3) and open the Additional Data model (4). Scroll down until you find the Weather Data variable (5).

Open the Weather Data variable (1) and click the {>} icon (2) to insert the entity reference into the Expression Text Area. Click Evaluate (3) to see the results of the expression.

You should see the function evaluating to the value you entered in the Additional Data model previously.

Now that you are confident that the expression evaluates to the correct value, examine the entity reference that you retrieved from the Entity Selector.
{users.admin.models.additionalData:weatherData$daylength}There are four parts to the above expression.
The curly braces
{}indicate everything inside is a context reference.The context path
users.admin.models.additionalDataindicates the model, Additional Data.The variable
weatherDatais referenced by following the context path with a colon:and the variable name, resulting inusers.admin.models.additionalData:weatherDataThe variable
weatherDatahas a fielddaylength. To extract data from a specific field, follow the variable reference with the$character and then the field name, completing the necessary reference{users.admin.models.additionalData:weatherData$daylength}
Click OK to save and close the Expression Builder.
Complete the remaining fields for the binding. The binding should fire On Startup to get the current value of the variable. If the model variable changes while the dashboard is open, set the binding to fire On Event (1) and open the Select Activator window (2).

In order to have the binding fire any time the model is updated, select the Event menu item (1), open the Models context (2) and open the Additional Data model (3) then scroll down (4) to find the Context Variable Changed event.

Selecting the Context Variable Changed event indicates the event reference string. The event name is updated, and can be referenced with users.admin.models.additionalData:updated@. Click OK to save and close.

Open the Power Station dashboard to see your work.

The data is displayed correctly in the above image . To check if the event-activated binding for Current Day Length, you can change the value in the model, and see that the value is immediately reflected in the dashboard.
Conclusion
Now that you have an understanding of how to add data to dashboards from system contexts, the next step will be learning how to apply more advanced styles to dashboards.
Was this page helpful?