Interval Marker
An Interval Marker is used to highlight a fixed range of values against the domain or range axis for a category plot or an XY plot.
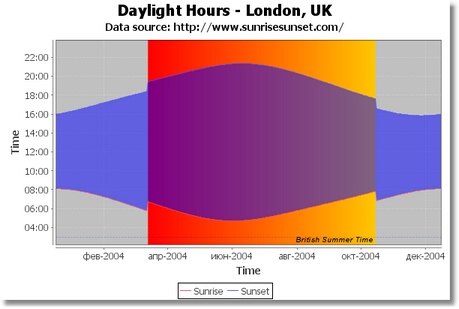
The below image shows a chart with an interval marker used to highlight a range of values on the domain axis:

Properties
See Marker for the list of generic marker properties.
Interval markers have the following additional properties:
Property | Name | Type | Description |
Start Value | startValue | Float | The lower bound of the interval to be highlighted. |
End Value | endValue | Float | The upper bound of the interval to be highlighted. |
Was this page helpful?