Box Annotation
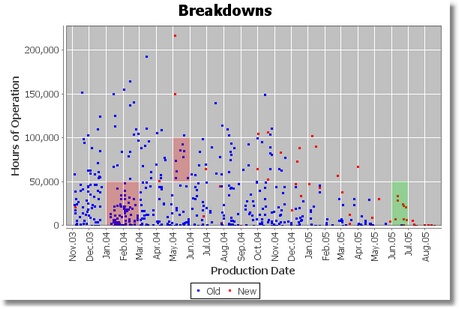
An annotation that highlights a rectangular region within the data area. The annotation will only be visible if it falls within the current bounds of the plot's axes.
 | It's possible to use this annotation with Date axes. Just specify the relevant coordinates in terms of milliseconds since 1-Jan-1970. |
Box annotation example:

Properties
Property | Name | Type | Description |
X | x | Float | Lower x-coordinate of the box. |
Y | y | Float | Lower y-coordinate of the box. |
Width | w | Float | Width of the box. |
Height | h | Float | Height of the box |
Fill Paint | fillPaint | Data Table | Paint used to fill the box. |
Stroke | stroke | Data Table | Stroke used to draw the box outline. |
Outline Paint | outlinePaint | Data Table | Paint used to draw the box outline. |
Tool Tip Text | toolTipText | String | The tool tip text for this annotation. |
Was this page helpful?