Block Chart
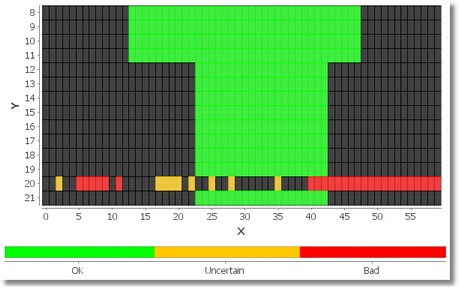
A block chart draws colored or gray-scale blocks in the 2D space to represent the z-values of the XYZ dataset. The z-values are converted to colors. |
|
The block chart is based on XY Plot and XY Renderer. It inherits all their properties.
This is what block chart looks like:
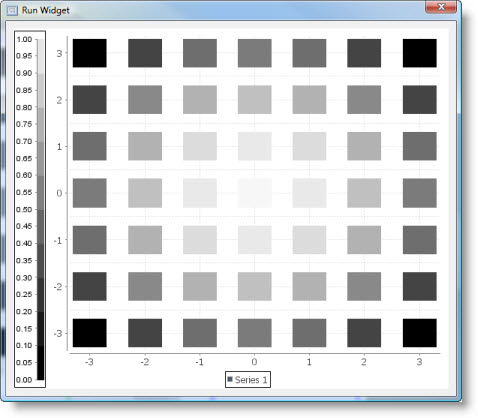
Block chart supports two renderers:
Block Renderer
This renderer uses colored rectangular blocks to represent the data items.
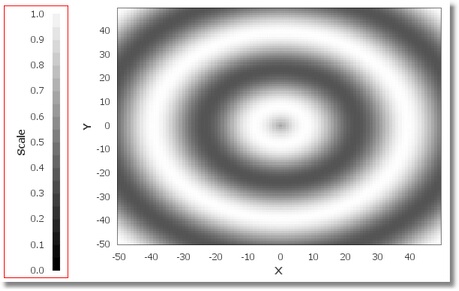
Shape Renderer
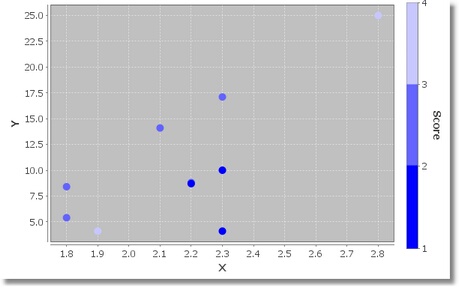
This renderer uses colored shapes to represent the data items.
Dataset
The interval chart supports Custom Data model only.
It has the following Source Data Bindings:
Binding | Expected Value Type | Description |
Series | String | Textual name of the data series. Data series is represented by a single line (or set of shapes) on the chart. |
X | Number | Block position along the domain (X) axis. |
Y | Number | Block position along the range (Y) axis. |
Z | Number | Z-value used to calculate the color of block/shape drawn at (X, Y) point. |
Common Properties
Width, Height, Bindings, Visible, Opaque, Background, Border
All Data-related properties.
All properties of a XY Plot.
All properties of a XY Renderer.
Custom Properties
Paint Scale
Paint scale is used to convert values within a certain range to colors (Paints).
There are two types of paint scales:
Grayscale paint scale specifies shades of gray to represent the values in a range. For values at the lower end of the range, the scale will return dark grey or black, and for values at the upper end of the range, the scale will return light grey or white. It is also possible to specify the alpha transparency for the returned colors.
Paint scale properties:
Property | Name | Type | Description |
Type | type | Integer | Scale type: Grayscale or Lookup. |
Lower Bound | lowerBound | Float | Lower bound of meaningful values for the scale. |
Upper Bound | upperBound | Float | Upper bound of meaningful values for the scale. |
Alpha | alpha | Float | Transparency value for colors generated by Grayscale scale, from 0 (fully transparent) to 255 (fully opaque). |
Default Paint | defaultPaint | Data Table | Default paint for Lookup scale. |
Lookup Table | lookupTable | Data Table | Table matching values to colors used by Lookup scale. Contains two fields:
|
Property name: paintScale
Property type: Data Table
Paint Scale LegendS
The table containing special chart legends (usually just one) displaying the Paint Scales.
Properties of a paint scale legend:
Property | Name | Type | Description |
Visible | visible | Boolean | Flag that indicates whether or not this legend should be displayed. |
Width | width | Float | Preferred width of the legend. |
Height | height | Float | Preferred height of the legend. |
Margins | margins | Data Table | Margin around the outside of the legend's frame. See Rectangle Insets. |
Padding | padding | Data Table | Area of whitespace inside the legend's frame. See Rectangle Insets. |
Frame | frame | Data Table | Border that will be drawn around the legend. See Block Frame. |
Position | position | String | Position of the legend within the chart (Top, Bottom, Left, or Right). |
Horizontal Alignment | horizontalAlignment | String | Horizontal alignment for the legend. Usually used if Position is Top or Bottom. |
Vertical Alignment | verticalAlignment | String | Vertical alignment for the legend. Usually used if Position is Left or Right. |
Axis | axis | Data Table | Value axis that shows the numerical range of the paint scale. |
Axis Location | axisLocation | String | Location of the axis relative to the legend. |
Axis Offset | axisOffset | Float | Offset between the color strip and the axis. See Rectangle Insets. |
Strip Width | stripWidth | Float | Width of the color strip. |
Strip Outline Visible | stripOutlineVisible | Boolean | Flag that controls whether or not an outline is drawn for the color strip. |
Strip Outline Paint | stripOutlinePaint | Data Table | Paint used to draw the outline for the color strip (if the outline is visible). |
Strip Outline Stroke | stripOutlineStroke | Data Table | Stroke used to draw the outline for the color strip (if the outline is visible). |
Background Paint | backgroundPaint | Data Table | Background paint for the legend. |
Subdivision Count | subdivisionCount | Integer | Number of subdivisions to use when drawing the paint scale. |
Property name: paintScaleLegends
Property type: Data Table
Block Width
Block width in data units (that is, measured against the domain axis). The default value is 1.0.
This property is valid for Block renderer.
Property name: blockWidth
Property type: Float
Block Height
Block height in data units (that is, measured against the range axis). The default value is 1.0.
This property is valid for Block renderer.
Property name: blockHeight
Property type: Float
Block Anchor
Anchor point on the block that will be aligned to the (x, y) location on the plot.
Available anchor values are Center, Top, Bottom, Left, Right, Top Left, Top Right, Bottom Left, and Bottom Right.
This property is valid for Block renderer.
Property name: blockAnchor
Property type: String
Draw Outlines
Flag that controls whether or not the renderer draws outlines for the shapes.
This property is valid for Shape renderer.
Property name: drawOutlines
Property type: Boolean
Use Outline Paint
Flag that controls whether or not the Outline Paint attribute is used for drawing shape outlines. If this flag is set to false, the regular series paint is used for drawing the outlines.
This property is valid for Shape renderer.
Property name: useOutlinePaint
Property type: Boolean
Use Fill Paint
Flag that controls whether the regular paint or the fill paint in the renderer is used for filling shapes.
This property is valid for Shape renderer.
Property name: useFillPaint
Property type: Boolean
Guide Lines Visible
Flag that controls whether or not guide lines are drawn.
This property is valid for Shape renderer.
Property name: guideLinesVisible
Property type: Boolean
Guide Line Paint
Paint used to draw the guide lines.
This property is valid for Shape renderer.
Property name: guideLinePaint
Property type: Data Table
Guide Line Stroke
Stroke used to draw the guide lines.
This property is valid for Shape renderer.
Property name: guideLineStroke
Property type: Data Table
Common Events
Hidden, Shown, Moved, Resized, Mouse Clicked, Mouse Pressed, Mouse Released, Mouse Entered, Mouse Exited, Mouse Moved, Mouse Wheel Moved, Key Typed, Key Pressed, Key Released, Focus Gained, Focus Lost
All relevant chart events.
Additional Examples
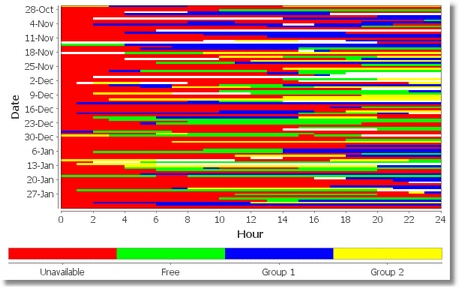
A block chart using Date range axis:
Another block chart example:
Was this page helpful?
