Pie Chart
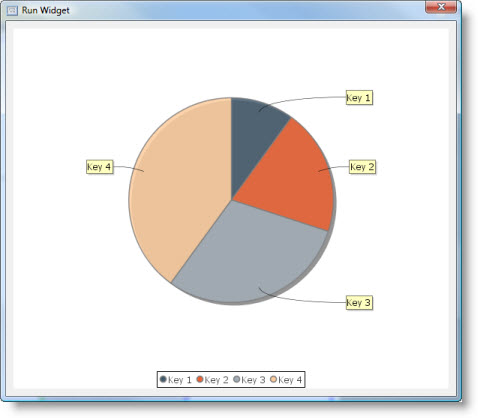
A pie chart is a circular chart divided into sectors, illustrating proportion. The arc length of each sector (and consequently its central angle and area), is proportional to the value it represents. |
|
The pie chart is based on Pie Plot. It inherits all its properties.
 | Pie chart has no renderer. |
This is what pie chart looks like:

Dataset
The pie chart supports Custom Data model only.
It has the following Source Data Bindings:
Binding | Expected Value Type | Description |
Series | String | Textual name of the data series. Data series is represented by individual pie section. |
Value | Number | The value for the series, i.e. pie section size. There is no need to normalize the values and make their sum equal to 1 or 100%, this is done automatically by the chart. |
Common Properties
Width, Height, Bindings, Visible, Opaque, Background, Border
Source Data and Source Data Bindings properties.
All properties of a Pie Plot.
Custom Properties
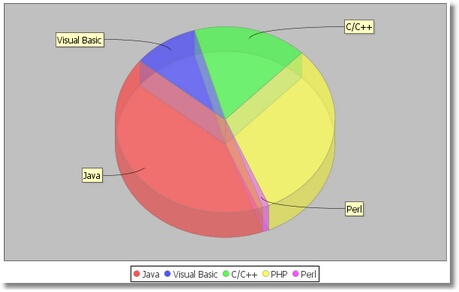
3d
Flag that control whether or not the chart is rendered in 3D mode.
Example of 3D pie chart:

 | 3D pie chart does not support exploded sections. |
Property name: chart3D
Property type: Boolean
Depth Factor
Depth factor specifies the size of the 3D effect as a percentage of the height of the plot area. The default value is 0.12 (twelve percent).
This property is valid for 3D mode only.
Property name: depthFactor
Property type: Float
Darker Sides
Flag that controls whether or not the sides of the pie plot are drawn using a darker color.
This property is valid for 3D mode only.
Property name: darkerSides
Property type: Boolean
Common Events
Hidden, Shown, Moved, Resized, Mouse Clicked, Mouse Pressed, Mouse Released, Mouse Entered, Mouse Exited, Mouse Moved, Mouse Wheel Moved, Key Typed, Key Pressed, Key Released, Focus Gained, Focus Lost
All relevant chart events.
Was this page helpful?
