Area Chart
A category area chart represents the items using polygons that fill the area between the domain axis and the data points. |
|

The area chart is based on Category Plot and Category Renderer. It inherits all their properties.
This is what category area chart looks like:
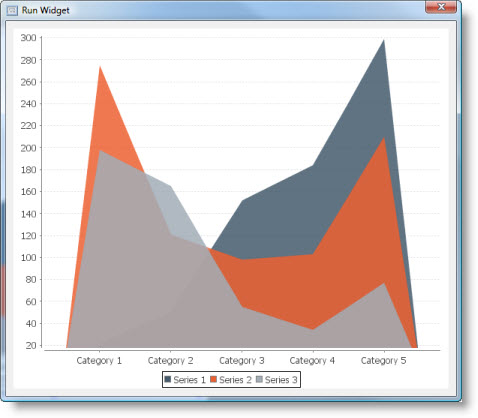
Category area chart supports two renderers.
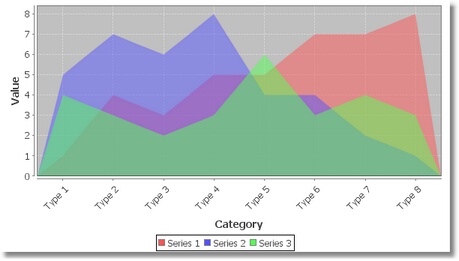
Area Renderer
A renderer that draws different data series one over another. Since different series overlap each other, they are rendered semi-transparently. The transparency is controlled by Foreground Alpha property of the chart plot.
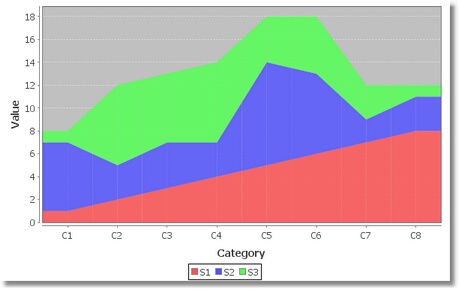
Stacked Renderer
A renderer that "stacks" different data series one over another.
Dataset
The category area chart supports Custom Data model only.
It has the following Source Data Bindings:
Binding | Expected Value Type | Description |
Series | String | Textual name of the data series. |
Category | String | Name of category. Categories are displayed along the domain axis. |
Value | Number | Numeric value to display for the above series/category. Values are displayed along the range axis. |
Common Properties
Width, Height, Bindings, Visible, Opaque, Background, Border
Source Data and Source Data Bindings properties.
All properties of a Category Plot.
All properties of a Category Renderer.
Custom Properties
End Type
Controls how the end points are drawn on the area chart. There are three options:
- Taper: Taper down to zero.
- Truncate: Truncates at the first and last values.
- Level: Fill to the edges of the chart level with the first and last data values.
Property name: endType
Property type: String
Render as Percentages
Flag that controls whether the renderer displays each item value as a percentage (so that the stacked areas add to 100%).
This property is valid for Stacked Renderer.
Property name: renderAsPercentages
Property type: Boolean
Common Events
Hidden, Shown, Moved, Resized, Mouse Clicked, Mouse Pressed, Mouse Released, Mouse Entered, Mouse Exited, Mouse Moved, Mouse Wheel Moved, Key Typed, Key Pressed, Key Released, Focus Gained, Focus Lost
All relevant chart events.
Was this page helpful?