Microsoft SQL Server Monitoring
Iotellect Network Manager provides an efficient out-of-the-box Microsoft SQL Server monitoring.
Configuring Access Permissions for MS SQL Server Monitoring
You must be given SELECT permission, also VIEW SERVER STATE and VIEW DATABASE STATE permission.
Creating a Device for MS SQL Server Monitoring
To monitor Microsoft SQL Server make the following steps:
sqljdbc4.jar into the /jar subfolder of Iotellect Server installation folder. | There is an alternative JDBC driver jTDS JDBC Driver. It supports versions of Microsoft SQL Server lower then 10.0 (SQL Server 2005, SQL Server 2000) and Domain Authentication. At the time of writing, it is available at http://jtds.sourceforge.net/. In case of using jTDS JDBC Driver the first two steps should be following: jtds-X.X.X.jar into the /jar subfolder of Iotellect Server installation folder. |
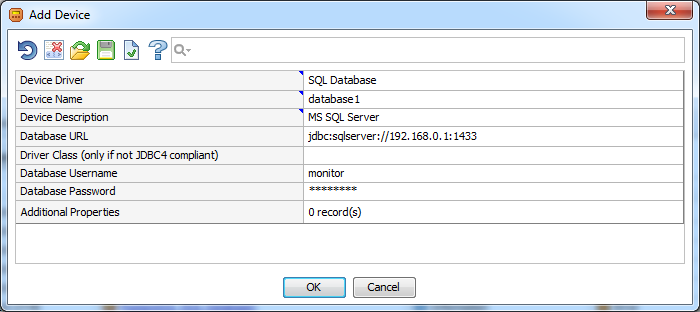
Devices container in the system tree. Device name field and enter device description in the Device Description field if necessary. Database URL setting for the Microsoft SQL Server database has the following format: jdbc:sqlserver://[serverName[instanceName][:port]];databasename=dbname[;property=value[;property=value]], where jdbc:sqlserver:// is known as the sub-protocol and is constant, serverName is the DNS name or IP address of the server to connect to (can be localhost), instanceName is the instance to connect to on serverName (If not specified, a connection to the default instance is made), portNumber is the port to connect to on serverName (The default is 1433). For example, if your Microsoft SQL Server runs on 192.168.0.1, on the default port, use the following URL to connect to the default instance: jdbc:sqlserver://192.168.0.1:1433. You can also omit the default port and use jdbc:sqlserver://192.168.0.1 instead. | In case of using jTDS JDBC Driver the
|

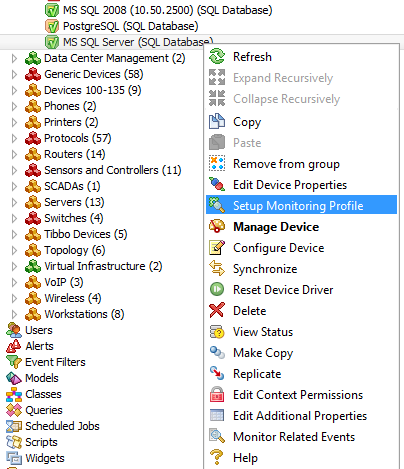
OK button and on the Device Properties menu click OK button again. If connection is successful the new device will be available in the system tree with the icon in green. Setup Monitoring Profile from the list of the device's available actions.
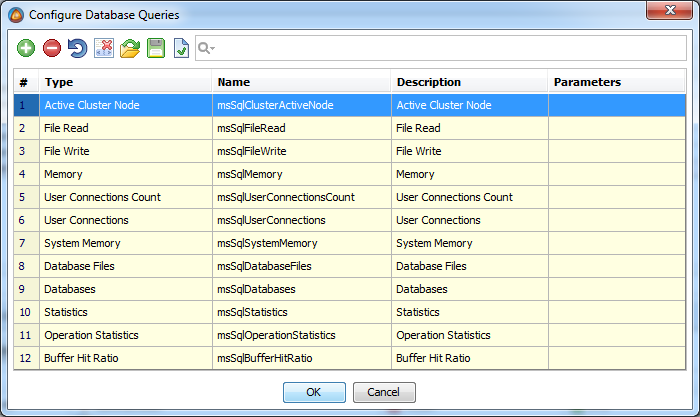
Create Queries field and press OK button.
OK button.
Device Properties created queries will be available in the Queries tab. Variable's Synchronization Options Settings and Statistics Channels have already been configured and also available in the corresponding tabs. Available Metrics
Monitored Microsoft SQL Server KPIs:
- Buffer cache hit ratio
- Memory utilization and usage efficiency
- Work with pages
- General, activity and lock statistics
- Access method statistics
- Active user connections and sessions
- I/O subsystem
- Disk space utilization
- And more
Was this page helpful?