Bubble Chart
A bubble chart draws bubbles of different sizes (diameters) in 2D space. |
|
The bubble chart is based on XY Plot and XY Renderer. It inherits all their properties.
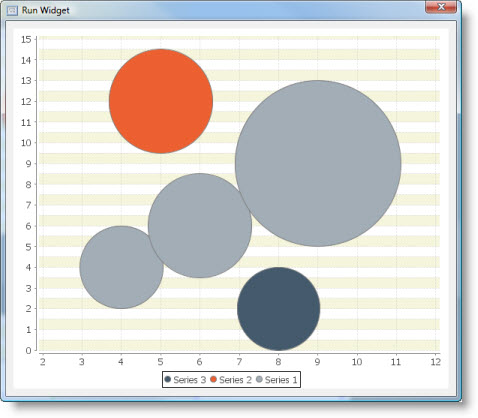
This is what bubble chart looks like:

Dataset
The bubble chart supports Custom Data model only.
It has the following Source Data Bindings:
Binding | Expected Value Type | Description |
Series | String | Textual name of the data series. |
X | Number | X (domain) coordinate of the bubble center. |
Y | Number | Y (range) coordinate of the bubble center. |
Z | Number | Z-value, that may be bubble diameter, its length along the X-axis or its length along the Y-axis. These depends on the Scale Type property. |
Common Properties
Width, Height, Bindings, Visible, Opaque, Background, Border
All Data-related properties.
All properties of a XY Plot.
All properties of a XY Renderer.
Custom Properties
Scale Type
Method used to determine the size of the bubbles drawn by this renderer:
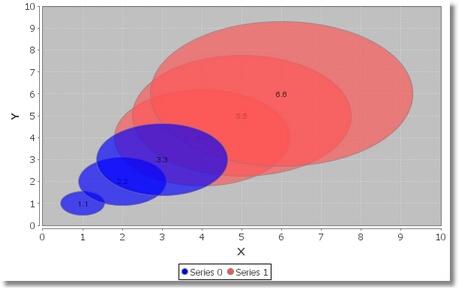
- Scale On Both Axes: bubbles are drawn as ellipses where the width and height of the ellipse is determined by the z-value scaled against both axes;
- Scale On Domain Axis: bubbles are drawn as circles where the diameter of the circle is determined by the z-value scaled against the domain axis;
- Scale On Range Axis: bubbles are drawn as circles where the diameter of the circle is determined by the z-value scaled against the range axis.
Property name: scaleType
Property type: Integer
Common Events
Hidden, Shown, Moved, Resized, Mouse Clicked, Mouse Pressed, Mouse Released, Mouse Entered, Mouse Exited, Mouse Moved, Mouse Wheel Moved, Key Typed, Key Pressed, Key Released, Focus Gained, Focus Lost
All relevant chart events.
Additional Examples
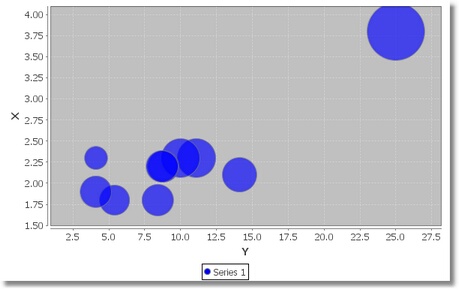
A simple demo bubble chart with one data series:

A bubble chart with item labels and Scale Type set to Scale On Both Axes:

Was this page helpful?
