XY Line Chart
An XY line chart simply connects each (X, Y) data item using straight lines. |
|
The line chart is based on XY Plot and XY Line Renderer. It inherits all their properties.
This is what XY line chart looks like:
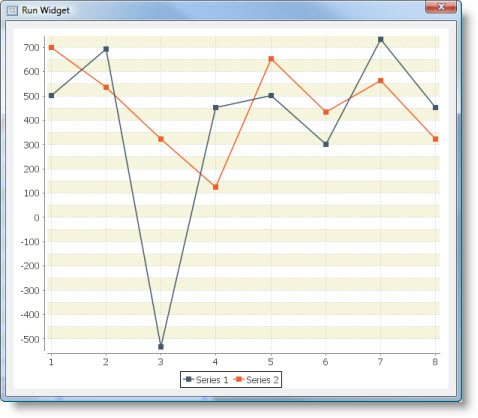
XY line chart supports four renderers:
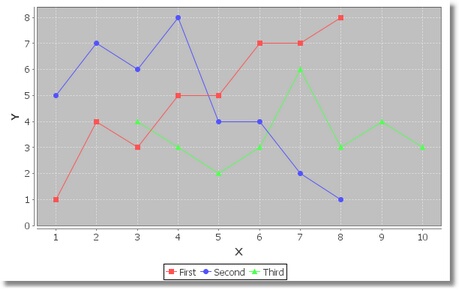
Line Renderer
A renderer that displays items by drawing a line between each (x, y) point and overlaying a shape at each (x, y) point.
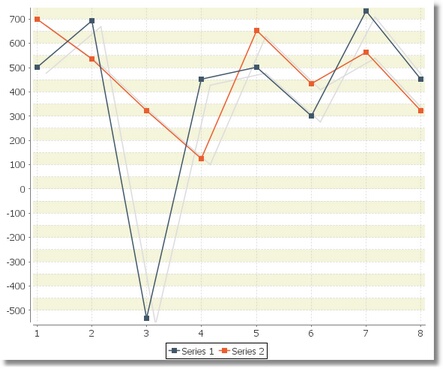
Line 3D Renderer
A line renderer that uses a "pseudo-3D" effect to draw line charts.
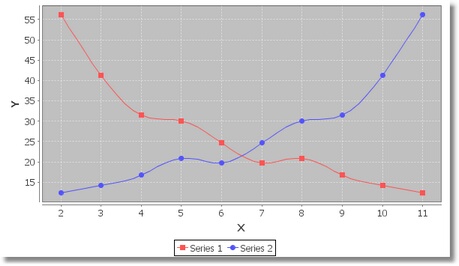
Spline Renderer
This renderer connects data points using spline curves. This results in a smooth line passing through all the data points.
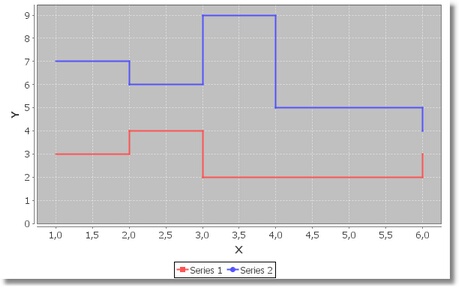
Step Renderer
This renderer draws items using "stepped" lines to connect each (x, y) point.
Dataset
The XY line chart supports several data models:
It has the following Source Data Bindings:
Binding | Expected Value Type | Description |
Series | String | Textual name of the data series. Data series is represented by a single line (or set of shapes) on the chart. |
X | Number | Numeric value to display along the domain (X) axis. |
Y | Number | Numeric value to display along the range (Y) axis. |
Common Properties
Width, Height, Bindings, Visible, Opaque, Background, Border
All Data-related properties.
All properties of a XY Plot.
All properties of a XY Line Renderer.
Custom Properties
X Offset
X-offset for the 3D effect.
This property is valid for Line 3D renderer.
Property name: XOffset
Property type: Float
Y Offset
Y-offset for the 3D effect.
This property is valid for Line 3D renderer.
Property name: YOffset
Property type: Float
Wall Paint
Paint used to color the "sides" (or "walls") of the plot background area.
This property is valid for Line 3D renderer.
Property name: wallPaint
Property type: Data Table
Precision
Number of line segments used to approximate the curve between data points.
This property is valid for Spline renderer.
Property name: precision
Property type: Integer
Step Point
Fraction of the domain position between two points on which the step is drawn. The default is 1.0, which means the step is drawn at the domain position of the second point. If the Step Point is 0.5 the step is drawn at half between the two points.
This property is valid for Step renderer.
Property name: stepPoint
Property type: Float
Common Events
Hidden, Shown, Moved, Resized, Mouse Clicked, Mouse Pressed, Mouse Released, Mouse Entered, Mouse Exited, Mouse Moved, Mouse Wheel Moved, Key Typed, Key Pressed, Key Released, Focus Gained, Focus Lost
All relevant chart events.
Additional Examples
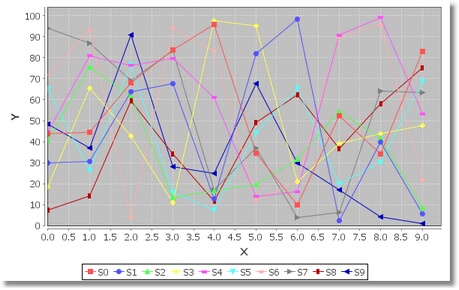
A line chart with many series. A shape is displayed at each data point to help to differentiate the series:
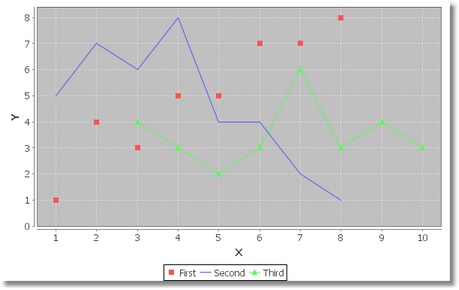
A line chart where each series is displayed with a different combination of lines and/or shapes:
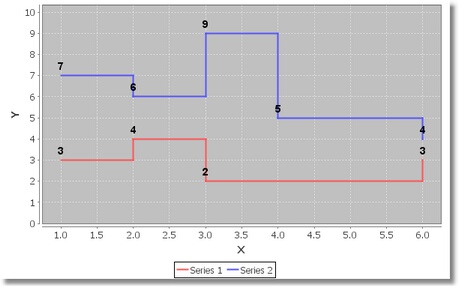
A "step" chart with item labels:
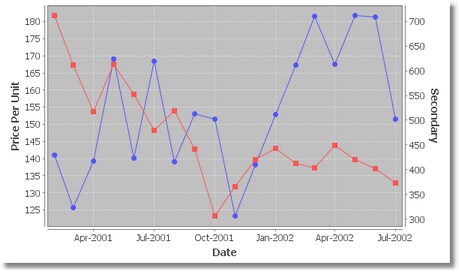
A line chart with two range axes:
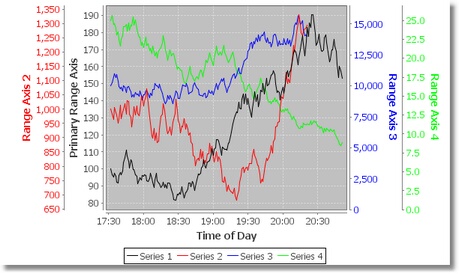
A line chart with multiple range axes:
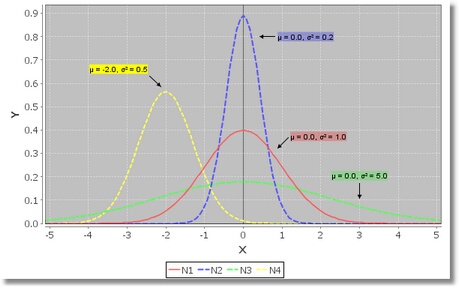
An XY line chart with four data series and pointer annotations:
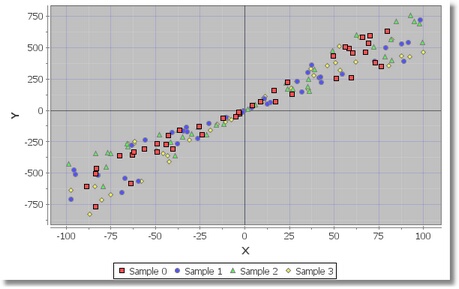
A scatter plot that displays multiple data series. It uses Line renderer with Default Lines Visibility disabled:
Was this page helpful?
