Useful Browser Tools
Web dashboards and even individual components can be tricky to troubleshoot, especially when it comes to the initial intricacy of some components' markup multiplied by style cascades that redefine the elements’ properties many times.
Developer tools available in any mainstream browser can help navigate through possible issues and figure out the right course of action when working with dashboard components customization.
Accessing Developer Tools
To get access to browser’s developer tools, press F12 on Windows/Linux or Option + ⌘ + I on Mac while on the page you want to inspect. Alternatively, you can right-click on any place at the page and select the Inspect (or similar) option from the appeared context menu.
The exact composition of the developer tools' UI depends on the browser, but the set of the available tools is essentially the same for any of them. Most of the things needed to work with component styles are always located within the first tab of any developer tools' UI. Here how it looks in the Google Chrome DevTools:
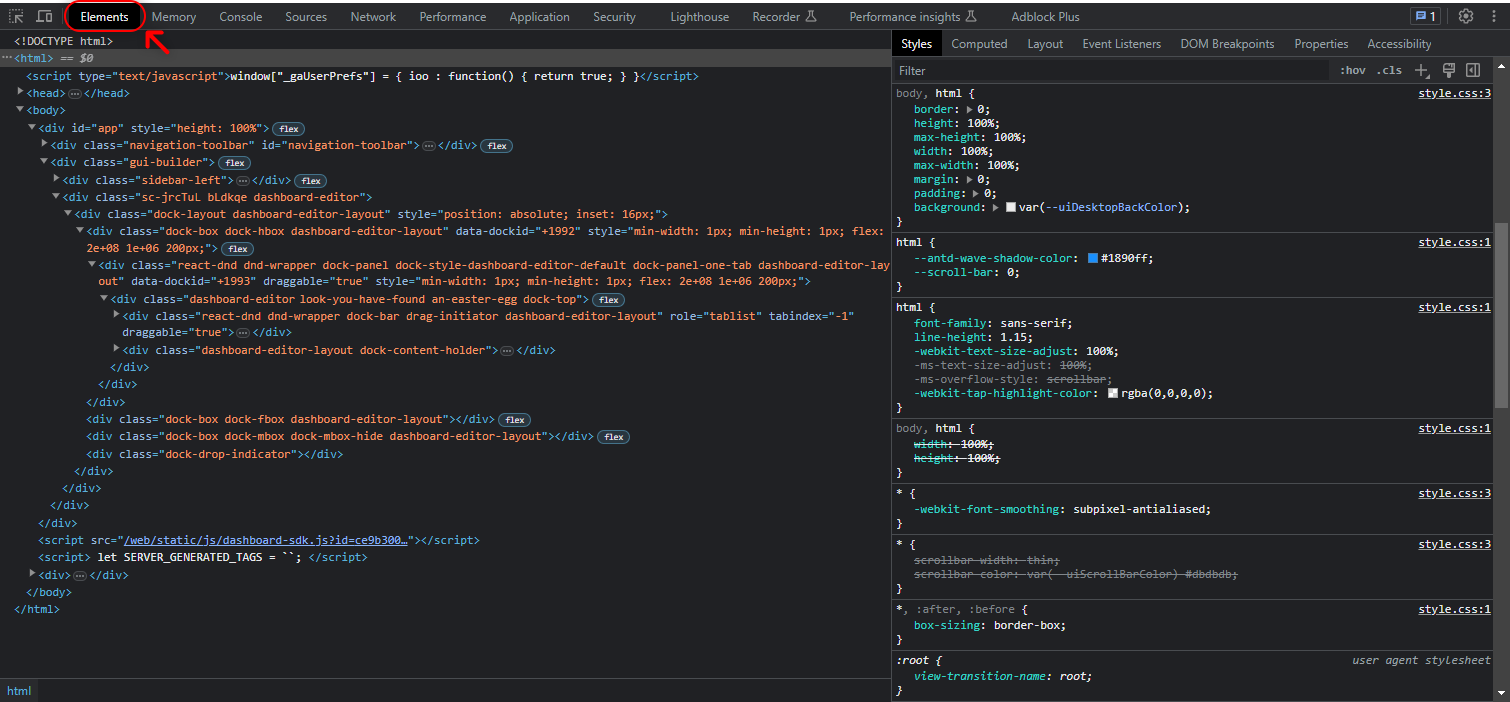
The left part shows the entire HTML structure of the webpage, and the right part gives access to the detailed overview of a selected element. Hovering over and selecting elements in the DOM tree highlights them on the page, providing additional bits of visual information about their markup.
Inspector Tool
The fastest way to reach the right HTML element in DOM is to use the Inspector Tool.
Usually, the Inspector Tool button is located at the left-top corner of the developer tools' UI no matter which tab is selected. Look for something like these icons:
When active, it enables the cursor to highlight HTML elements by hovering over them. At the same time the element is also highlighted in the DOM in the developer tools' window you activated the Inspector Tool from.
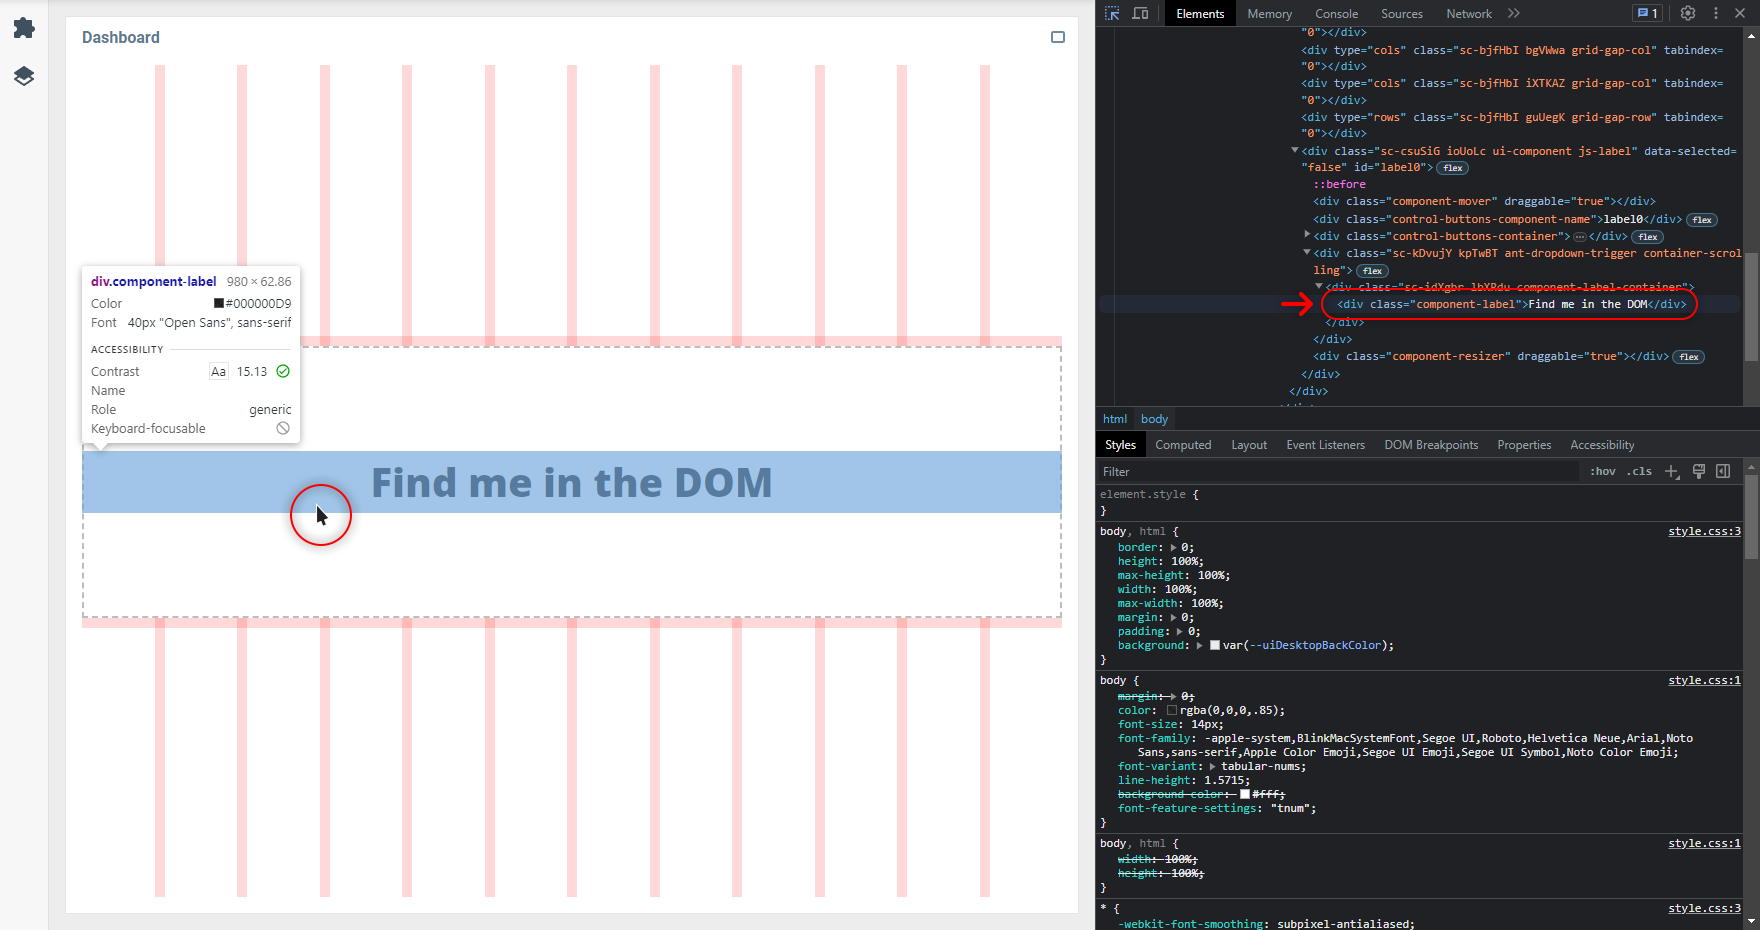
 | In different browsers, the amount of additional information about the highlighted element’s markup may vary. |
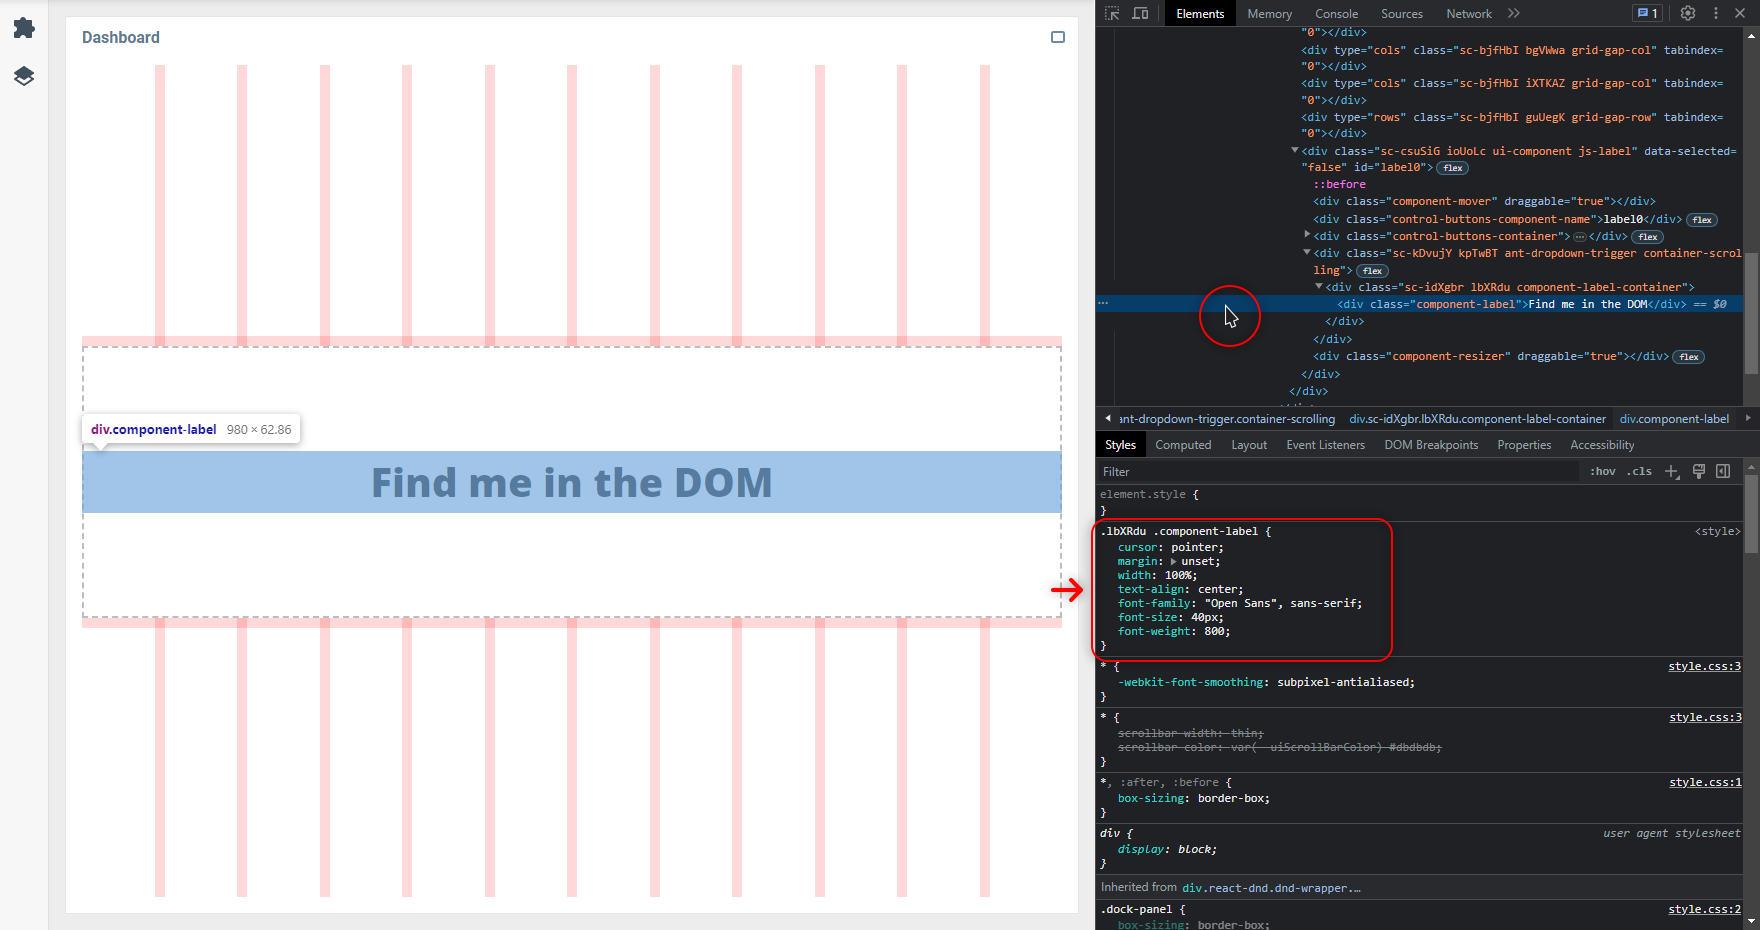
By clicking on the highlighted element you will be scrolled to its location in the document tree available at the first tab of the developer tools, with all parent nodes expanded down to the selected element. The block with the detailed information about the selected element by default will have the Styles (or similar) tab open.
 | You can also use the regular search in DOM by component’s content or if you know the exact element’s attribute values. To get access to the search field, open Search from the developer tools menu or press |
Inspecting Element Styles
The Styles tab in browser’s developer tools lists all the styles that are applied to a selected HTML element from any source, including all inherited properties and the overridden styles. Hovering over a rule will highlight the elements on the page that match it.
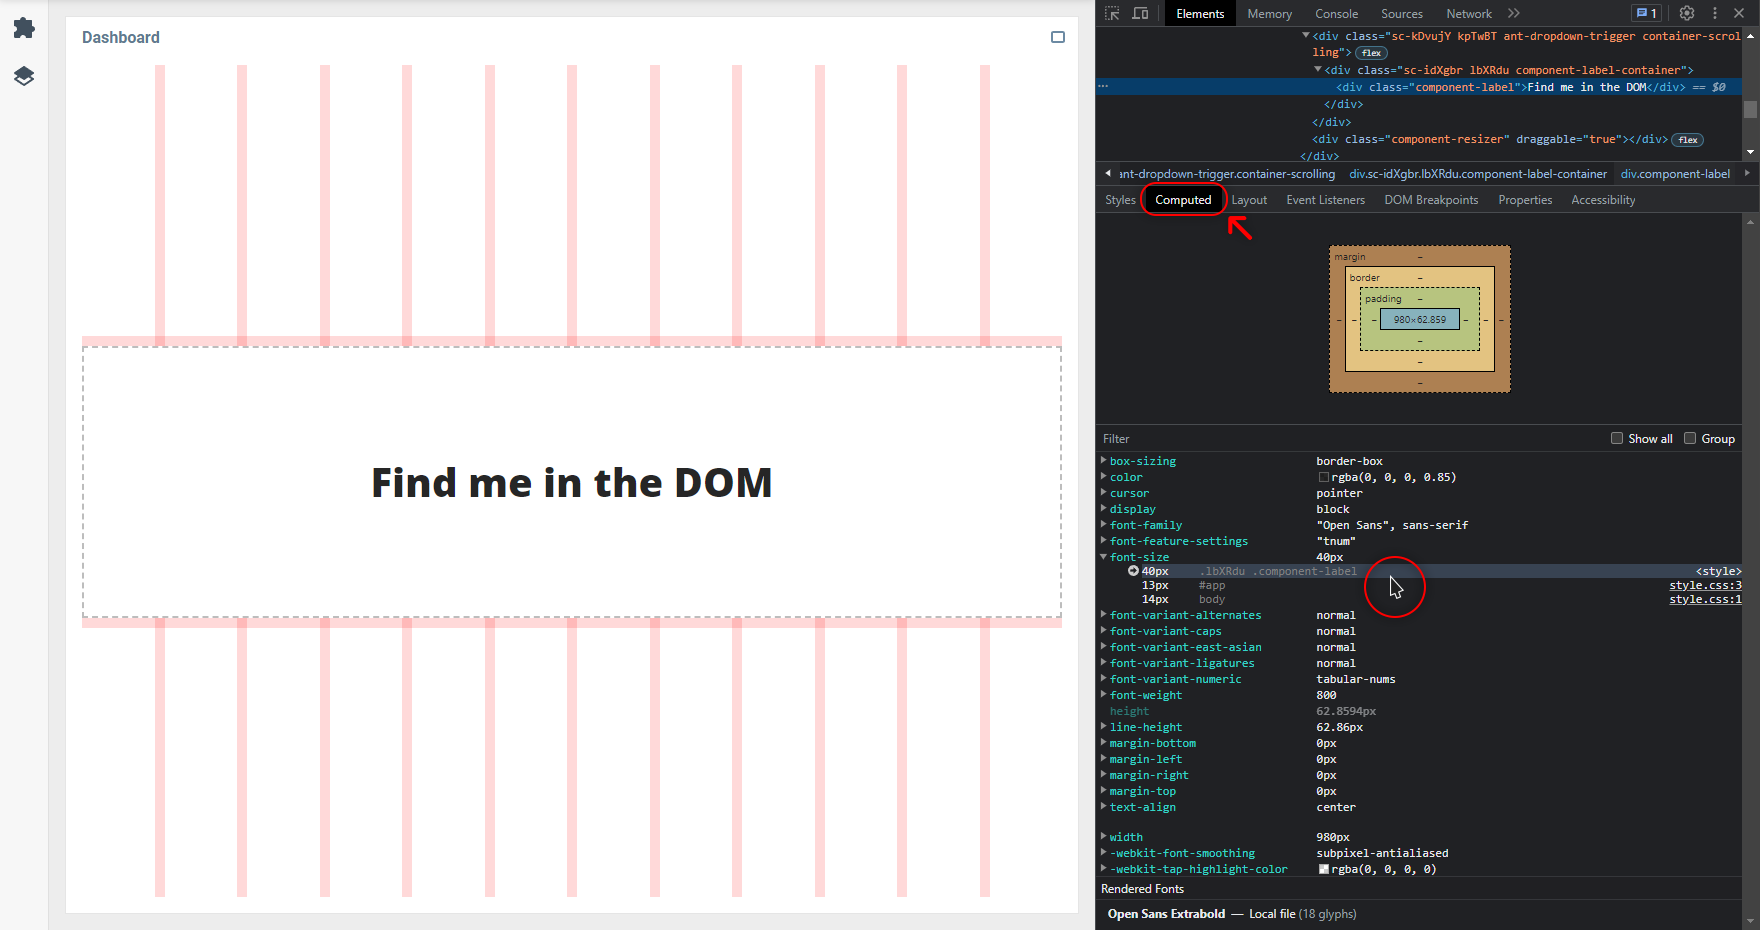
To get a quick summary of what CSS properties are actually applied to a selected element, switch to the Computed tab next to the Styles. Here you get to see the component’s active CSS properties listed in alphabetical order. Expand them to find out which rule is responsible for the applied value and what rules were overridden.
Forcing Element States
In case of a component having out-of-the-box user interaction states support or user action pseudo-classes being applied to its elements, the styles assigned to those states won’t be visible in the Style tab until the component enters the respective state.
To force an element to enter and keep any state while still being able to operate with the cursor, right-click on the element in the document tree and choose a state from the Force State (or similar) group of the appeared context menu.
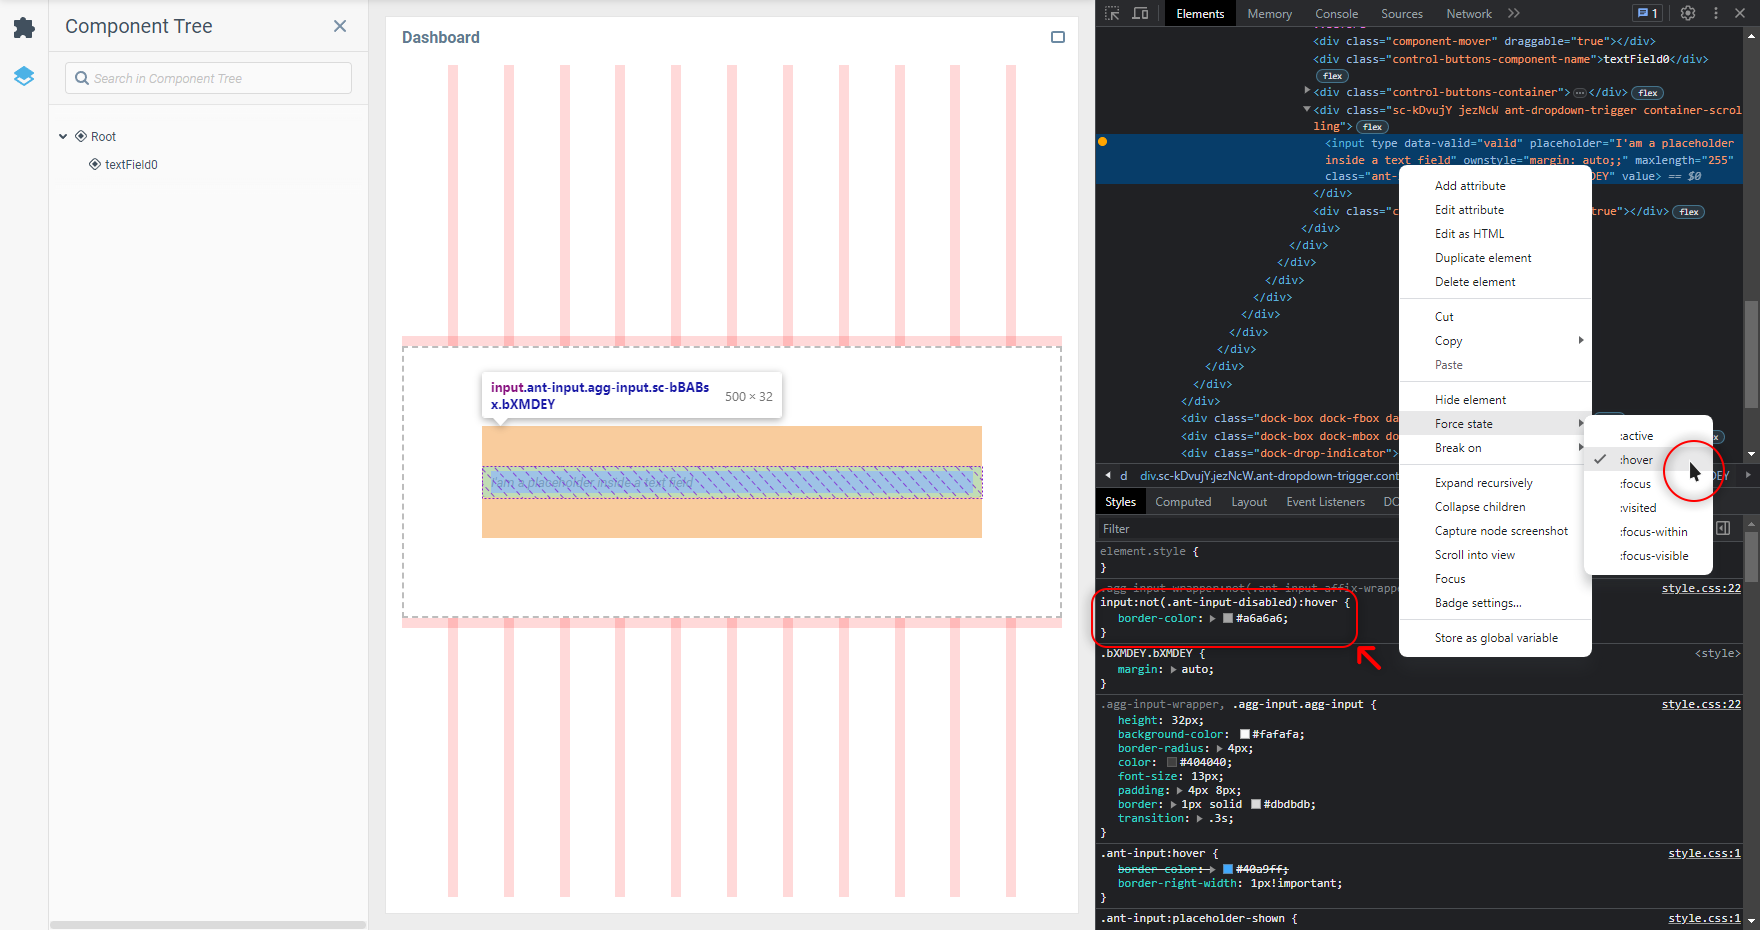
Once the state has been enabled, the CSS rules matching it will appear in the element’s style list.
Was this page helpful?