Meter
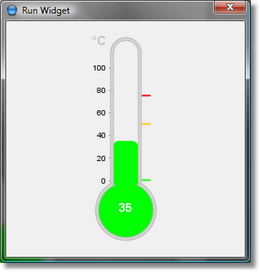
This component displays a meter that is best used for indicating temperature, pressure and similar values. The meter has three subranges, shown in different colors. |
|
This is what a gauge component looks like:

Common Properties
Width, Height, Bindings, Visible, Border, Cursor, Popup Menu
Custom Properties
Value
Data value indicated by meter.
Property name: value
Property type: Float
Plot
A configuration of meter plot, i.e. "graphical part" of a meter.
Fields of meter plot:
Field | Type | Description |
Lower Bound | Float | Lower bound for the meter. |
Upper Bound | Float | Upper bound for the meter. |
Axis Location | Integer | The axis can be displayed at the left or right of the meter, or not displayed at all. |
Background Alpha | Float | The alpha transparency value used when coloring the plot’s background. |
Background Paint | Data Table | Paint used to draw the background of the plot area. |
Bulb Radius | Integer | Radius of the meter bulb. |
Column Radius | Integer | Radius of the main column of the meter. |
Follow Data In Subranges | Boolean | Flag that controls whether or not the axis range automatically changes to show only the subrange within which the current data value falls. |
Gap | Integer | Gap between the outlines used to represent the meter. |
Insets | Data Table | The amount of space to leave around the outside of the plot. |
Mercury Paint | Data Table | Default mercury Paint used when value is outside of all subranges. |
Outline Paint | Data Table | Paint used to draw an outline around the plot area. |
Outline Stroke | Data Table | Stroke used to draw an outline around the plot area. |
Outline Visible | Boolean | Flag that controls whether or not the outline is drawn. |
Padding | Data Table | Padding (top, left, bottom, right) around the outside of the meter. |
Meter Paint | Data Table | Paint used to draw the outline of the meter. |
Meter Stroke | Data Table | Stroke used to draw the outline of the meter. |
Units | Integer | Unit type. Can be set to Fahrenheit, Celsius or Kelvin degrees is meter is used to represent the temperature, or to No units displayed otherwise. |
Use Subrange Paint | Boolean | Flag that controls whether or not the sub-range colors are used for the mercury in the meter. |
Value Font | Data Table | Font used to display the value label, if it is visible. |
Value Location | Integer | Location at which the current value will be displayed (None, Right, Left, or Bulb). Note that the default Value Paint color is white, so if you change the location you should also change the color so that the label remains visible. |
Value Paint | Data Table | Paint used to display the value label, if it is visible. |
Property name: plot
Property type: Data Table
Axis
Configuration of meter axis.
Fields of meter axis:
Field | Type | Description |
Label | String | The axis label typically describes what an axis is measuring. |
Label Angle | Float | The angle of rotation for the axis label. |
Label Font | Data Table | The font for the axis label. |
Label Insets | Data Table | The space to leave around the outside of the axis label. |
Label Paint | Data Table | The paint for the axis label. |
Tick Label Font | Data Table | The font for the tick labels. |
Tick Label Insets | Data Table | The space to leave around the outside of the tick labels. |
Tick Label Paint | Data Table | The paint for the tick labels. |
Tick Labels Visible | Boolean | A flag controlling the visibility of tick labels. |
Tick Mark Inside Length | Float | The amount by which the tick marks extend into the plot area |
Tick Mark Outside Length | Float | The amount by which the tick marks extend outside the plot |
Tick Mark Paint | Data Table | The paint used to draw the tick marks. |
Tick Mark Stroke | Data Table | The stroke used to draw the tick marks. |
Tick Marks Visible | Boolean | A flag controlling the visibility of tick marks. |
Visible | Boolean | A flag that controls whether or not the axis is visible. |
Property name: axis
Property type: Data Table
Subranges
Table of meter subranges used to indicate normal, warning and critical values.
Fields of a subrange:
Field | Type | Description |
Subrange | String | Subrange name, read-only. |
Lower Bound | Float | Lower bound for the subrange. |
Upper Bound | Float | Upper bound for the subrange. |
Display Low | Float | Lower display bound. The display bounds are only used if the meter axis range is automatically adjusted to display the current sub-range (i.e. Follow Data In Subranges flag of Meter Plot is enabled). |
Display High | Float | Upper display bound. |
Paint | Data Table | Mercury paint used to display values within the subrange. |
Property name: subranges
Property type: Data Table
Common Events
Hidden, Shown, Moved, Resized, Mouse Clicked, Mouse Pressed, Mouse Released, Mouse Entered, Mouse Exited, Mouse Moved, Mouse Wheel Moved, Key Typed, Key Pressed, Key Released, Focus Gained, Focus Lost
Was this page helpful?
