Debugging Queries
Some queries may execute without errors but return unpredictable or unexpected results. Such behaviour may be caused by non-critical errors that occur during query execution. The Query debugging feature helps view these errors. To run a query in debug mode, use the Debug Query action defined in the Query Context. This action lets you browse a query debug report before showing execution result.
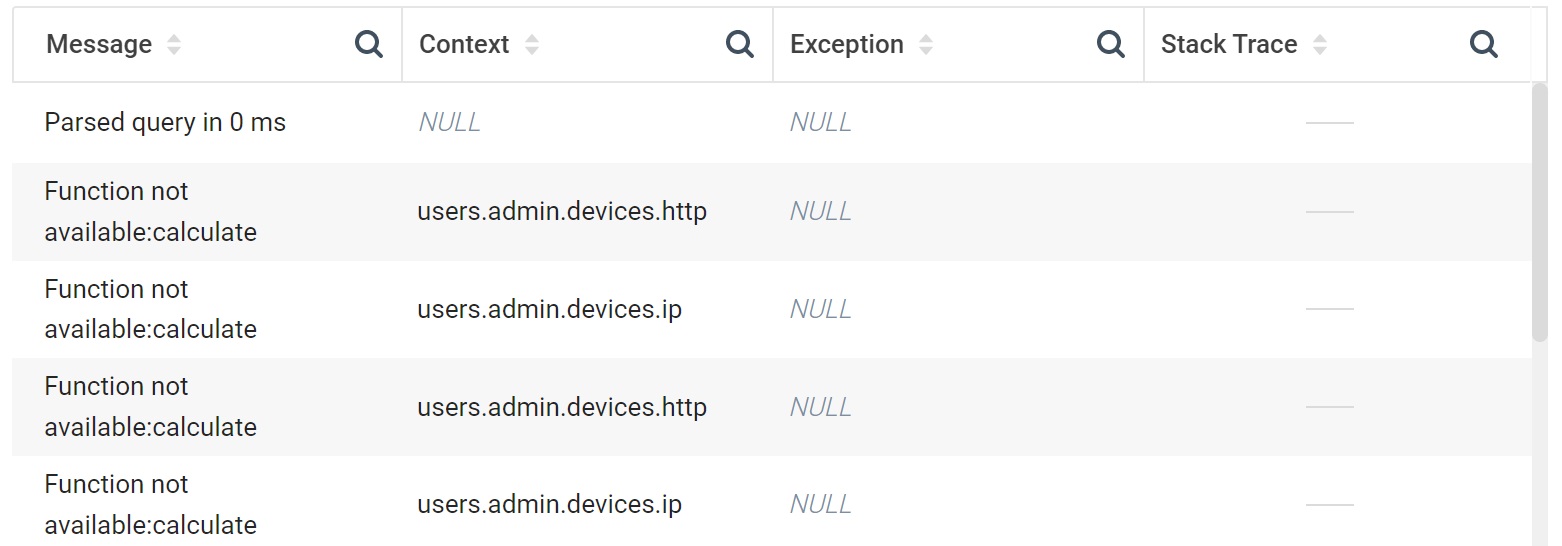
The debug report has the following fields:
- Message. Debug message.
- Context (optional). Server context processing the data which caused the error.
- Exception (optional). Text of the error generated by the context when the query accessed its variables or functions.
- Stack Trace (optional). Stack trace of exception generated by Iotellect Server. May be requested by Iotellect technical support team during resolving of complex problems. A stack trace is just computer-generated debug information -- it's not supposed to be very human-readable.
Here is an example of debug report:
Query Performance Debugging
Query execution report also shows time taken by different stages of the execution process. This information is crucial for query performance assessment.
Was this page helpful?