Mixed XY Chart
A mixed XY chart is a composite chart designed to combine two or more "simple" XY charts within a single plot. These sub-charts share the plot and axes, but each of them has its own dataset and renderer. |
|
This is what mixed XY chart looks like:
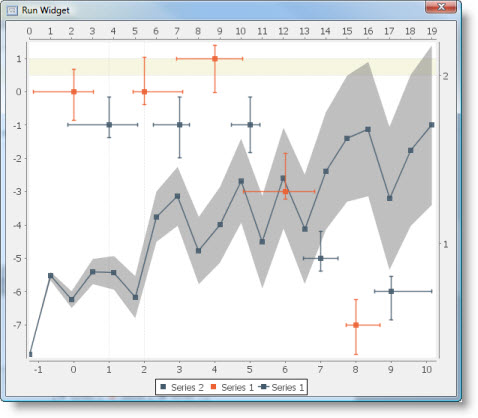
When a "simple" XY chart is added as a sub-chart to a mixed XY chart, is has the following differences from its "standalone" version:
- Axes of the sub-chart are added to the axes list of the container chart. The sub-chart has no own axes. Instead, it has references to the parent chart's axes to use for displaying the data. By default, the axes moved from sub-chart to its parent are referenced.
- The sub-chart has no plot-related properties, since its data will be rendered on the parent's plot.
- The sub-chart has no chart common properties, the parent mixed chart has its own set of chart common properties.
- The sub-chart has no widget component default properties, except for the Bindings property, since it is not rendered separately.
Custom Properties of Sub-Charts
Every "simple" XY chart added as a sub-chart to a mixed XY chart supports all trending properties and has several additional properties:
Domain Axis Index
The index of parent mixed chart's domain axis to use. First axis in the parent's domain axes table has index 1.
Property name: domainAxisIndex
Property type: Integer
Range Axis Index
The index of parent mixed chart's range axis to use. First axis in the parent's range axes table has index 1.
Property name: rangeAxisIndex
Property type: Integer
Z-Order
Z-index of the sub-chart in the parent's plot. Charts with lower order numbers overlap chart's with higher order numbers.
Property name: index
Property type: Integer
Common Properties
Width, Height, Bindings, Visible, Opaque, Background, Border
All properties of a XY Plot.
Custom Properties
None defined.
Common Events
Hidden, Shown, Moved, Resized, Mouse Clicked, Mouse Pressed, Mouse Released, Mouse Entered, Mouse Exited, Mouse Moved, Mouse Wheel Moved, Key Typed, Key Pressed, Key Released, Focus Gained, Focus Lost
All relevant chart events.
Additional Examples
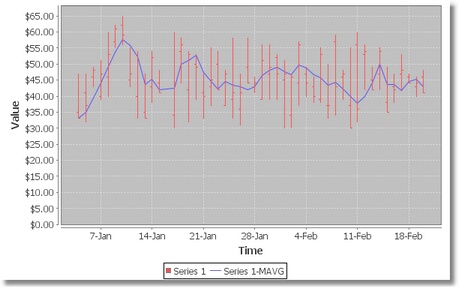
A mixed chart with a financial sub-chart and a moving average trend sub-chart:
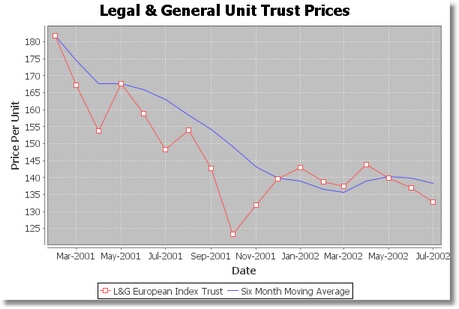
A mixed chart with a line sub-chart and a moving average trend sub-chart:
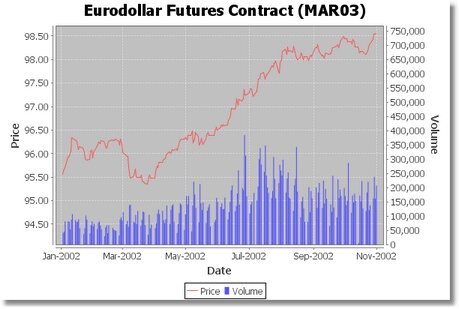
A mixed chart with line and bar sub-charts:
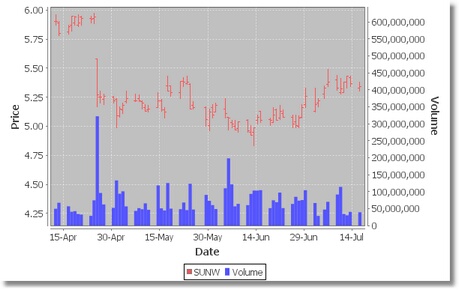
A mixed chart with financial and bar sub-charts:
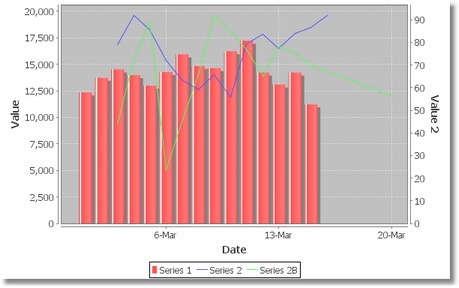
Another mixed chart with line and bar sub-charts using different range axes:
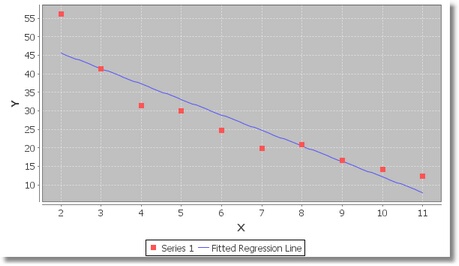
A mixed chart with a line sub-chart using shape-only rendering (i.e. Default Lines Visible is disabled) and a linear trend sub-chart:
Was this page helpful?
