Value Marker
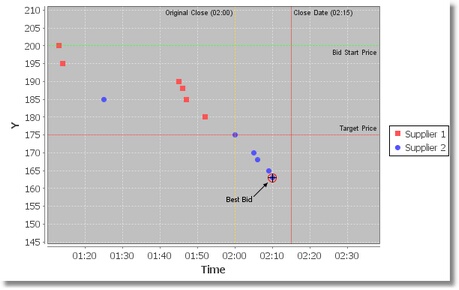
A value marker is used to indicate a constant value against the domain or range axis for a category plot or an XY plot.
The marker is most often drawn as a line, but in a chart with a 3D-effect the marker will be drawn as a polygon. For this reason, the marker has both Paint and Outline Paint attributes, and Stroke and Outline Stroke attributes.
The image showing a chart having several value markers and a pointer annotation:

Properties
See Marker for the list of generic marker properties.
Value markers have the following additional property:
Property | Name | Type | Description |
Value | value | Float | Value to mark. |
Was this page helpful?