XY Area Chart
An XY area chart represents the items using polygons that fill the area between the domain axis and the (X, Y) data points. |
|
The XY area chart is based on XY Plot and XY Renderer. It inherits all their properties.
This is what XY area chart looks like:
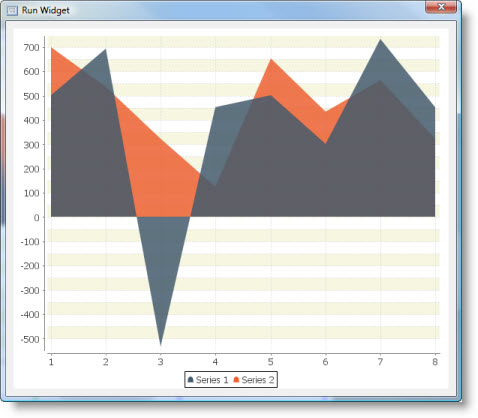
XY area chart supports four renderers:
Area Renderer
A renderer draws each item in an (X, Y) dataset using a polygon that fills the area between the x-axis and the data point.
The below example uses Date Axis as an x-axis.
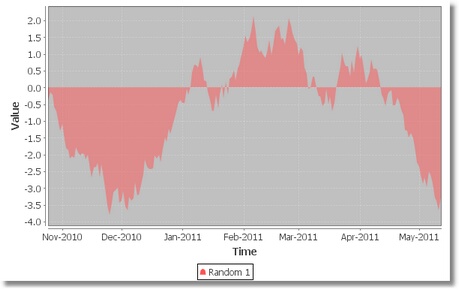
Stacked Renderer
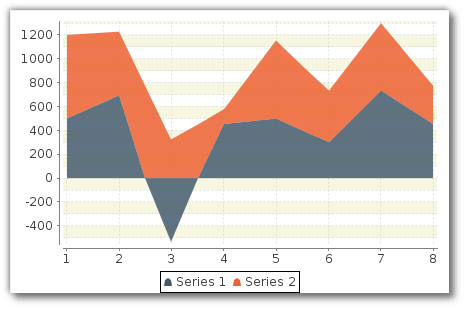
A renderer that fills the area under a series, and stacks each series on top of the other.
Step Renderer
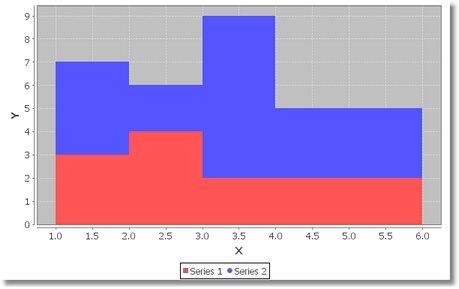
A renderer that displays data from an (X, Y) Dataset in a step format with the area under the steps filled.
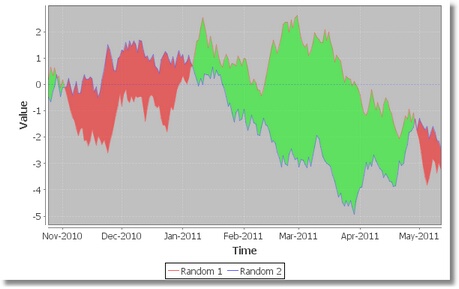
Difference Renderer
A renderer that highlights the difference between the items in two series by filling in the area between the lines for each series. The fill color alternates between a "positive" color (used when series 1 is greater than series 2) and a "negative" color (used when series 1 is less than series 2).
The below example uses Date Axis as an x-axis.
Dataset
The XY area chart supports several data models:
It has the following Source Data Bindings:
Binding | Expected Value Type | Description |
Series | String | Textual name of the data series. |
X | Number | Numeric value to display along the domain (X) axis. |
Y | Number | Numeric value to display along the range (Y) axis. |
Additional dataset properties:
Auto Sort
Flag that controls whether the items in the series are automatically sorted into ascending order by x-value.
Property name: autoSort
Property type: Boolean
Common Properties
Width, Height, Bindings, Visible, Opaque, Background, Border
All Data-related properties.
All properties of a XY Plot.
All properties of a XY Renderer.
Custom Properties
Outline
Flag that controls whether or not outlines are drawn.
This property is valid for Area and Step renderers.
Property name: outline
Property type: Boolean
Area Renderer Mode
Area renderer can work in several different modes:
- Area (normal mode)
- Area and Shapes (date item shapes are visible)
- Shapes and Lines (only date item shapes and item-to-item lines are visible, areas not filled; chart is similar to XY Line Chart)
- Lines (only item-to-item lines are visible, areas not filled; chart is similar to XY Line Chart)
- Shapes (only date item shapes are visible, areas not filled; chart is similar to XY Line Chart)
Example of Area and Shapes mode:
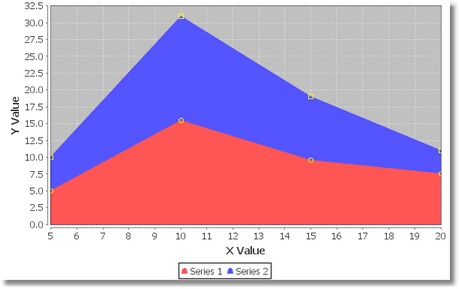
This property is valid for Area renderer.
Property name: XYAreaRendererMode
Property type: Integer
Round X Coordinates
Flag that controls whether or not the x-coordinates (in drawing space) are rounded.
This property is valid for Stacked and Difference renderers.
Property name: roundXCoordinates
Property type: Boolean
Plot Area
Flag that controls whether or not the area beneath the steps is filled.
This property is valid for Step renderer.
Property name: plotArea
Property type: Boolean
Shapes Visible
Flag that controls whether or not shapes are drawn at each data point.
This property is valid for Step renderer.
Property name: shapesVisible
Property type: Boolean
Shapes Filled
Flag that controls whether or not shapes (if visible) are filled.
This property is valid for Step renderer.
Property name: shapesFilled
Property type: Boolean
Range Base
Base value for the renderer. The default value is 0.0.
This property is valid for Step renderer.
Property name: rangeBase
Property type: Float
Positive Paint
Paint used to fill the area between series 1 and series 2 when the difference is positive.
This property is valid for Difference renderer.
Property name: positivePaint
Property type: Data Table
Negative Paint
Paint used to fill the area between series 1 and series 2 when the difference is negative.
This property is valid for Difference renderer.
Property name: negativePaint
Property type: Data Table
Common Events
Hidden, Shown, Moved, Resized, Mouse Clicked, Mouse Pressed, Mouse Released, Mouse Entered, Mouse Exited, Mouse Moved, Mouse Wheel Moved, Key Typed, Key Pressed, Key Released, Focus Gained, Focus Lost
All relevant chart events.
Was this page helpful?
