VMware Charts
Iotellect Network Manager includes a set of charts displaying virtual-machine related data.
The charts are available for creation and configuration via VMware group of Setup Monitoring Profile action:
- CPU Utilization chart
- Four Disk Performance charts: Disk Writes Number, Disk Reads Number, Disk Writes Rate and Disk Reads Rate
- Two (Absolute and Relative) Memory Usage charts
- Four Network Performance charts: Network Packets Transmitted, Network Packets Received, Network Transfer Rate, and Network Receive Rate
The VMware group is available for device contexts having vmTable SNMP variable.
To setup one or several VMware charts using Setup Monitoring Profile action:
- Select the VMware server device context
- Choose Setup Monitoring Profile item in context menu
- Check
VMwareitem inCreate Chartcolumn - In
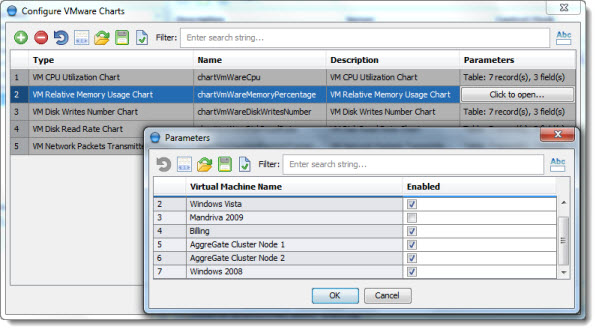
Configure VMware Chartswindow, add as many charts as you need, and configure them by specifying their types (one of the mentioned about), names, descriptions (as described in Setup Charts subsection of Setup Monitoring Profile), and parameters. All the VMware chart types have similar parameters: just check the virtual machines those metrics should be depicted. - A chart widget with the specified name and description will be created. You can find it under Widgets node in System Tree, or invoke from the device context menu (the menu item name will be the same as chart description provided).
VMware Status Charting
Chart Name | Description | Notes |
Indicates how much of the processor's capacity is currently used by the virtual machine(s). | The chart can be created for a particular SNMP-enabled context using Setup Monitoring Profile action. | |
Diagrams disk utilization, measured as a number of disk write operations performed since last synchronization. | The chart can be created for a particular SNMP-enabled context using Setup Monitoring Profile action. | |
Diagrams disk utilization, measured as a number of disk read operations performed since last synchronization. | The chart can be created for a particular SNMP-enabled context using Setup Monitoring Profile action. | |
Diagrams disk write rate in kilobytes per second. | The chart can be created for a particular SNMP-enabled context using Setup Monitoring Profile action. | |
Diagrams disk read rate in kilobytes per second. | The chart can be created for a particular SNMP-enabled context using Setup Monitoring Profile action. | |
Indicates current memory utilization in kilobytes. | The chart can be created for a particular SNMP-enabled context using Setup Monitoring Profile action. | |
Indicates current memory utilization percentage, i.e. memory used relative to amount of memory the virtual machine was configured with. | The chart can be created for a particular SNMP-enabled context using Setup Monitoring Profile action. | |
Diagrams a number of packets transmitted. | The chart can be created for a particular SNMP-enabled context using Setup Monitoring Profile action. | |
Diagrams a number of packets received. | The chart can be created for a particular SNMP-enabled context using Setup Monitoring Profile action. | |
Diagrams current transfer rate. | The chart can be created for a particular SNMP-enabled context using Setup Monitoring Profile action. | |
Diagrams current receive rate. | The chart can be created for a particular SNMP-enabled context using Setup Monitoring Profile action. |
Was this page helpful?