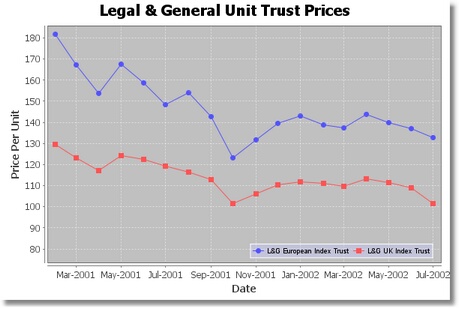
Legend Annotation
An annotation that can place a Legend within a chart.
Example of legend annotation:

Properties
Property | Name | Type | Description |
X | x | Float | X coordinate of the title in the range from 0.0 to 1.0. |
Y | y | Float | Y coordinate of the title in the range from 0.0 to 1.0. |
Max Width | maxWidth | Float | Maximum width for the annotation (specified as a percentage of the plot width, i.e. 0.05 is 5%). |
Max Height | maxHeight | Float | Maximum height for the annotation (specified as a percentage of the plot width, i.e. 0.05 is 5%). |
Legend | legend | Data Table | Legend to display. |
Anchor | anchor | String | Title anchor, which will be aligned to the (x, y) location on the chart when the annotation is displayed. |
Tool Tip Text | toolTipText | String | The tool tip text for this annotation. |
Was this page helpful?