Creating Consumption Reports
This tutorial explains how to create consumption reports based on aggregated values of consumables counters. Such a report can summarize hourly/daily/weekly/monthly/yearly consumption of the below and similar metrics:
Energy consumption (watt-hours)
Flow rates (cubic meters)
Equipment run times (hours)
Calculating Energy Consumption
For our example, we will create a Virtual Device which contains a random variable which changes every few seconds.
For our purposes, we will suppose that this random value indicates the current power consumption of the device in kilowatts. In order to create a report indicating the consumption rate, we need to get the consumption information grouped by different periods: days, weeks, months, and years.
Creating a Statistical Channel
We will use Statistical Process Control module to calculate consumption rates and aggregate them to get hourly/daily/weekly/monthly averages.
First of all, we need to create a statistical channel. It will perform all calculations of the energy consumption rates. To create a statistical channel click Edit Device Properties from the device context menu, choose the Statistical Channels tab (1) and add a new row to the channels table (2).
We name the channel energy_consumption and choose the variable we want to track, in this case it’s the random variable (3). Next we open the Parameters table (4).

From the parameters dialog, we enter a reference to desired field as the Expression. This expression must return a single value, which will be evaluated on every change of variable (i.e. each time the device is polled). It must always result in a number. Our random variable changes every minute and takes a value between 0 and 10, inclusive. We use the following expression:
round({.:random$value}*10)which is composed of the following parts:
The reference to our random variable value
{.:random$value}We multiply by ten, to make it a little easier more interesting
{.:random$value}*10We use the
round()function to simplify things a little.
In practice, we can use many mathematical operators here. If we suppose our random value is in kilowatts, we could make the conversion to watts by {.:random$value}*1000. Perhaps we are interested in getting the average energy consumption by minute of our device. In this case we know our device updates every 60 seconds, so we could think of our random value as “kilowatt minutes” and convert to kilowatt hours by using the conversion rule (1 hour / 60 minutes ) to get the expression {.:random$value} / 60
As far as kW is a measure of power being consumed, we set statistics our channel type to Gauge. This channel type calculates the current power consumption, so channel value will be measured in average kilowatts per minute. If we were measuring an electrical meter, with a continually increasing value of kW hours and wanted to measure the “change speed” of counter, we would use the Counter type. You can get more information about statistics channel types here.
Ultimately, our channel options look something like this:
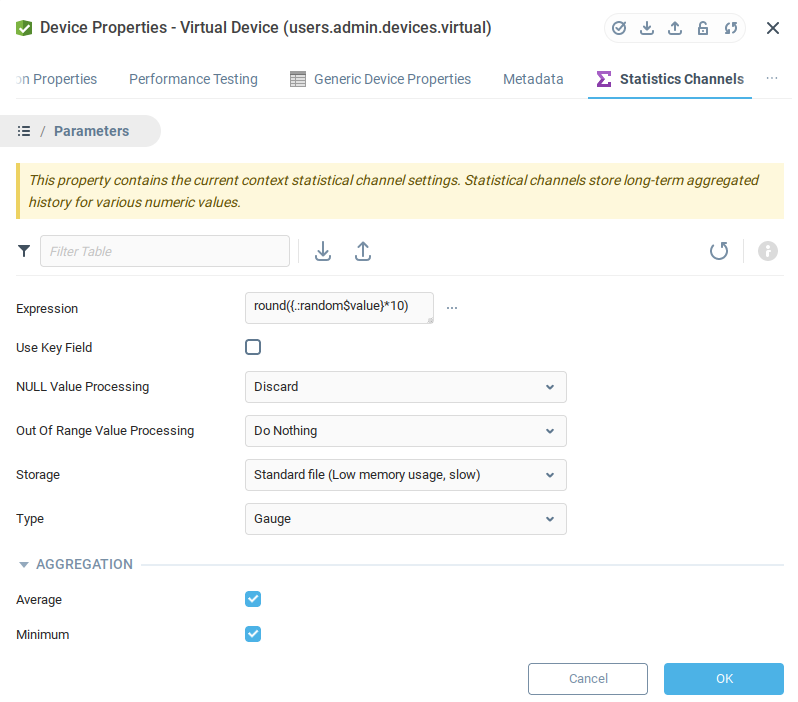
Note that we Selected Aggregation parameters means that Average, Minimum and Maximum values for each Storage Period will be calculated. Storage Periods define history length for each aggregation rate: one hour of minutely statistics (average rates for each of last 60 minutes), one day of hourly statistics, and so on.
Creating a Query to Get Source Data for the Consumption Report
Our consumption report will be based on a query. Open the context menu of the Queries node in the System Tree and click Create. Let's create a query with the following Query Text:
SELECT
 stats.statistics$context as "Device Context",
 stats.statistics$end as "Period",
 stats.statistics$average * 60 as "Average kW per hour"
FROM
utilities:statistics("users.admin.devices.virtual", "energy_consumption", null, "hour") as statsThis query calls the statistics function from Utilities context to get the statistical consumption rates. It passes the following parameters to this function:
"users.admin.devices.virtual" - the path to your device,
“energy_consumption” - the name of our statistical channel,
“null” - the row key, not used in our case,
“hour” - the aggregation rate (the query will give non-empty results if more than one hour has elapsed since we’ve created our statistical channel, but to debug it and see results earlier you can temporarily use “minutes” value here).
The query selects three fields from function’s result:
stats.statistics$context - the device context,
stats.statistics$end - the end timestamp of every aggregation period,
stats.statistics$average * 60 - the average per-minute consumption value multiplied by 60 minutes in an hour.
Here is the query configuration window:
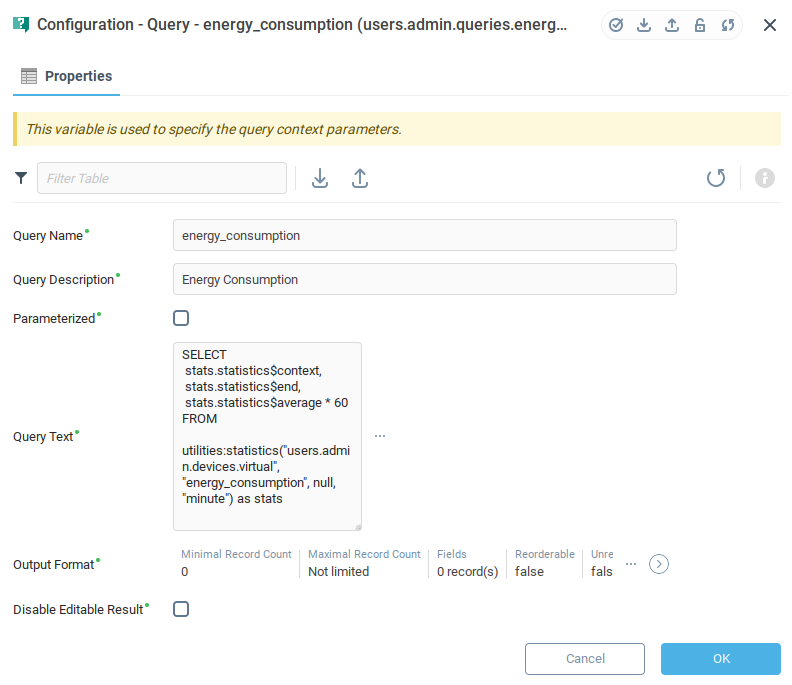
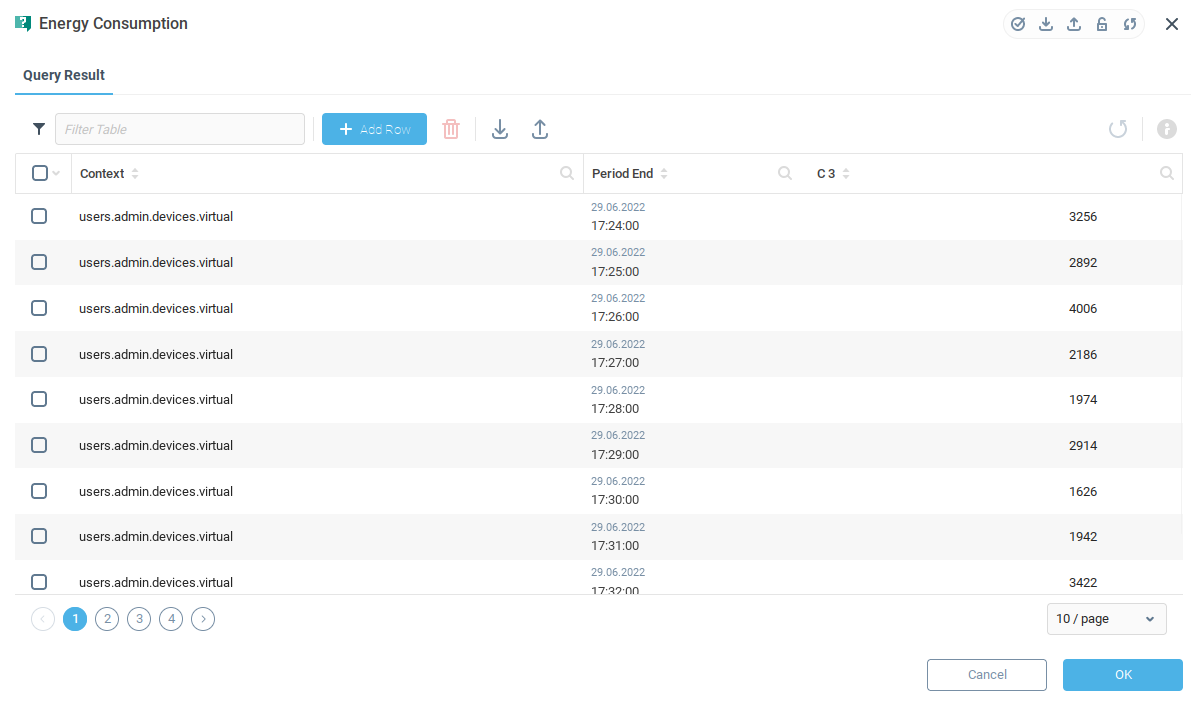
Once the query creation is finished, you can execute it by clicking on the query in the System Tree.

You should be able to see the aggregated consumption table.
Creating a Consumption Report Dashboard
We will create a simple dashboard to display the data from our query. To create a new dashboard, open the context menu of the Dashboard node in the System Tree and click Create. Enter Name and Description in the properties dialogue.
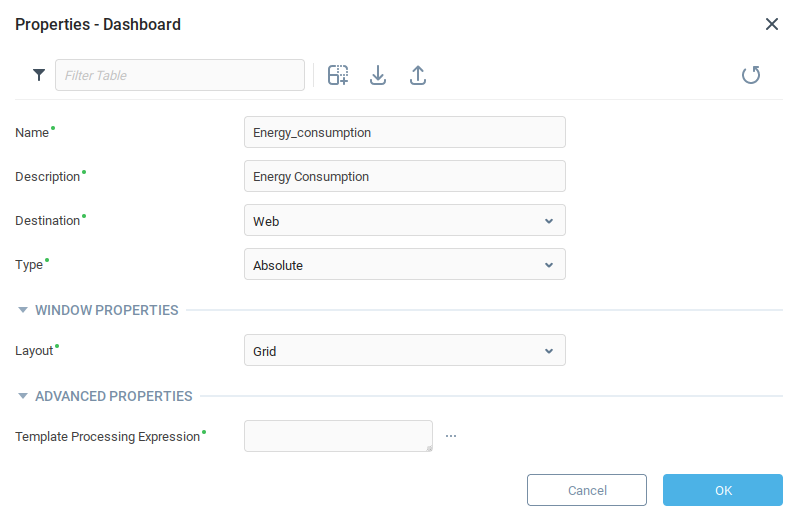
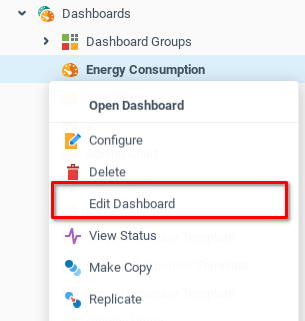
A new Dashboard node should be visible in the System Tree under the Dashboards node. Open the dashboard builder by opening the context menu of the new dashboard and selecting Edit Dashboard.
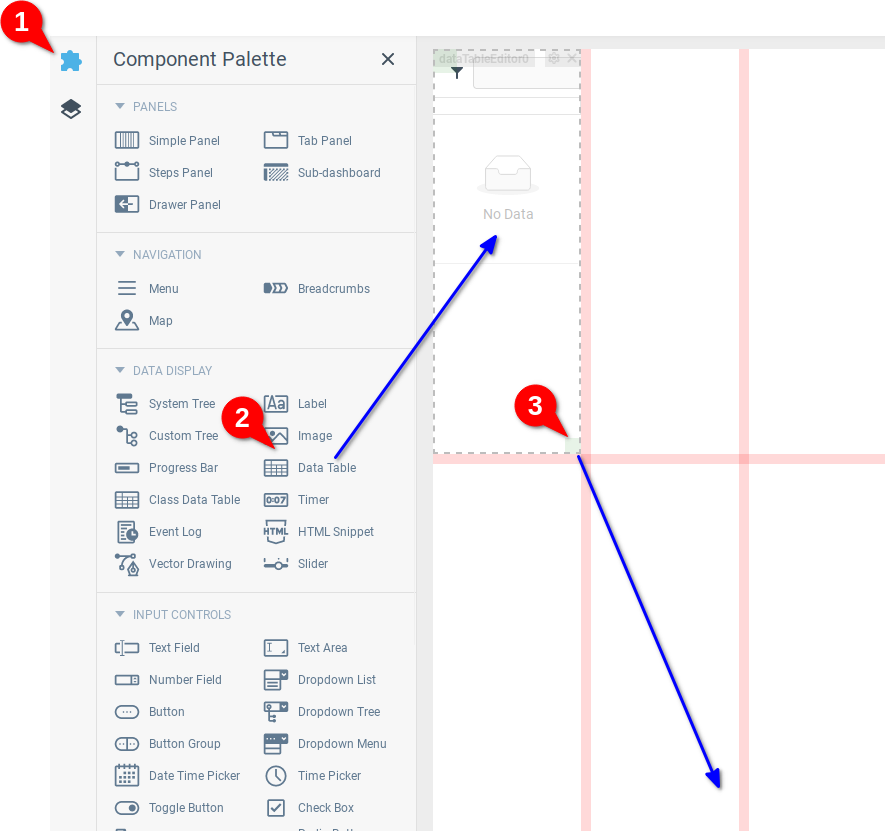
From the Dashboard editor select the Component Palette (1), and drag a Data Table component into the first grid cell (2). The bottom left corner of the new component (3) allows you to resize the table to take up a few more
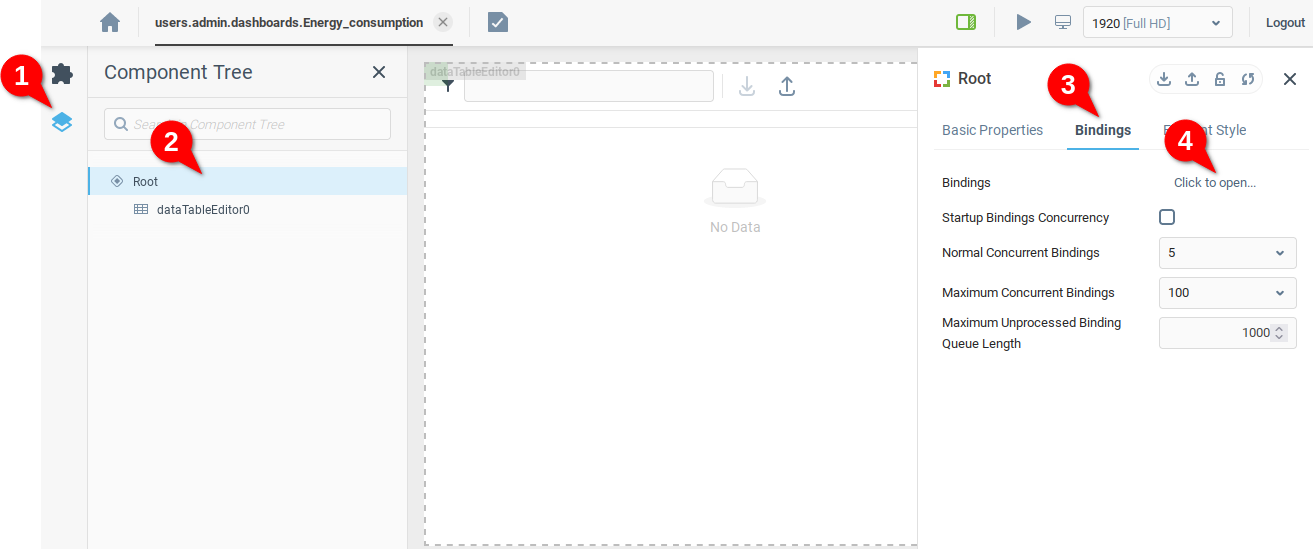
Now that we have a component to display the data, we will need to create a binding to collect and insert the data into the table. Open the Component Tree tab (1) and select the Root component (2). This is the fundamental component of the dashboard where the other components are located. From the Bindings tab (3) we open the Bindings table (4).
From the Bindings table, add a row (1) and select the “On Startup” option (2) as the trigger to run our binding. The next steps we will define our Data Table as the Target (3) for our data, and define an Expression (4) which will activate the query and retrieve the data from the query which we defined above.

Defining a Target
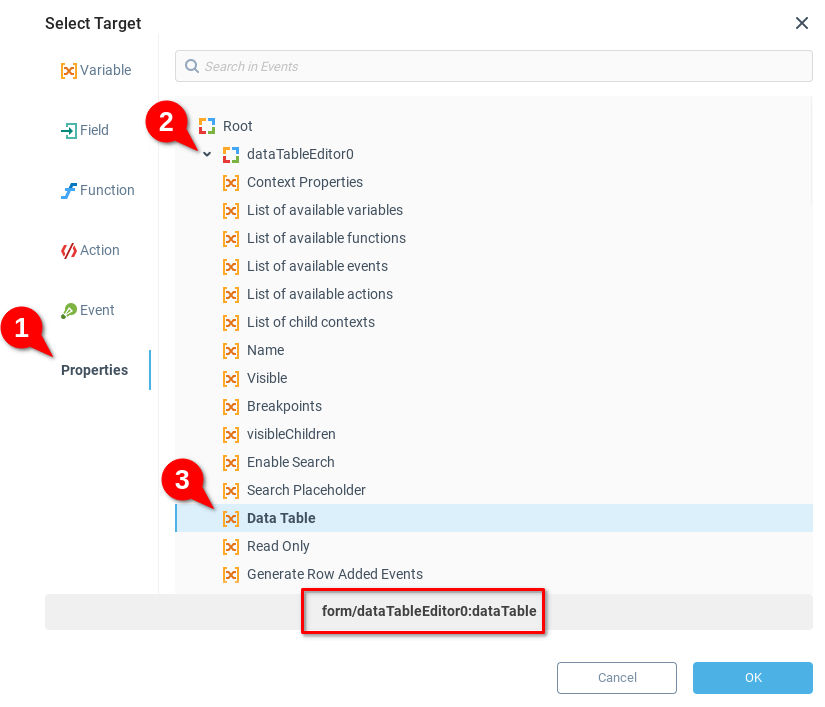
From the Select Target window, we choose the Properties (1) option, where we can find our root and all components of our Dashboard. We expand the dataTableEditor0 component (2) to expose the associated variables. Finally, we select the Data Table variable (3) as the place where we want to send our query data.
Defining an Expression
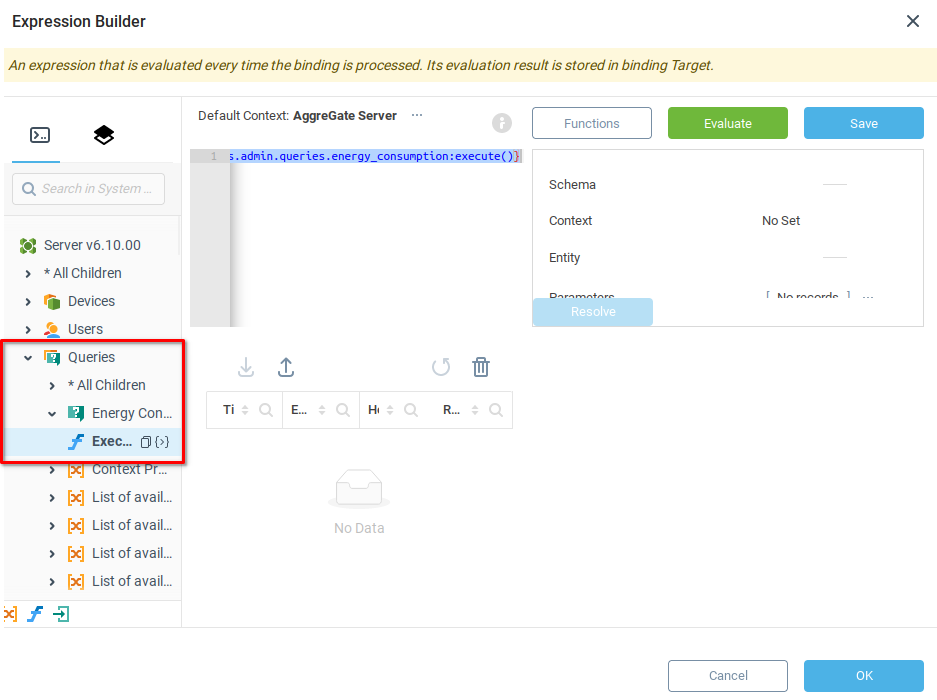
From the Expression Builder window we navigate to the Queries node, and expand it to find our previously defined Energy Consumption query. Expanding node, we find a function Execute Query and insert it into the expression by clicking the {>} button. As a result, the following expression is inserted into our builder.
{users.admin.queries.energy_consumption:execute()}
We can click Evaluate to see what the result of the expression will be when evaluated. Satisfied, we click OK
Having created our binding, we save (1) and preview (2) our dashboard.

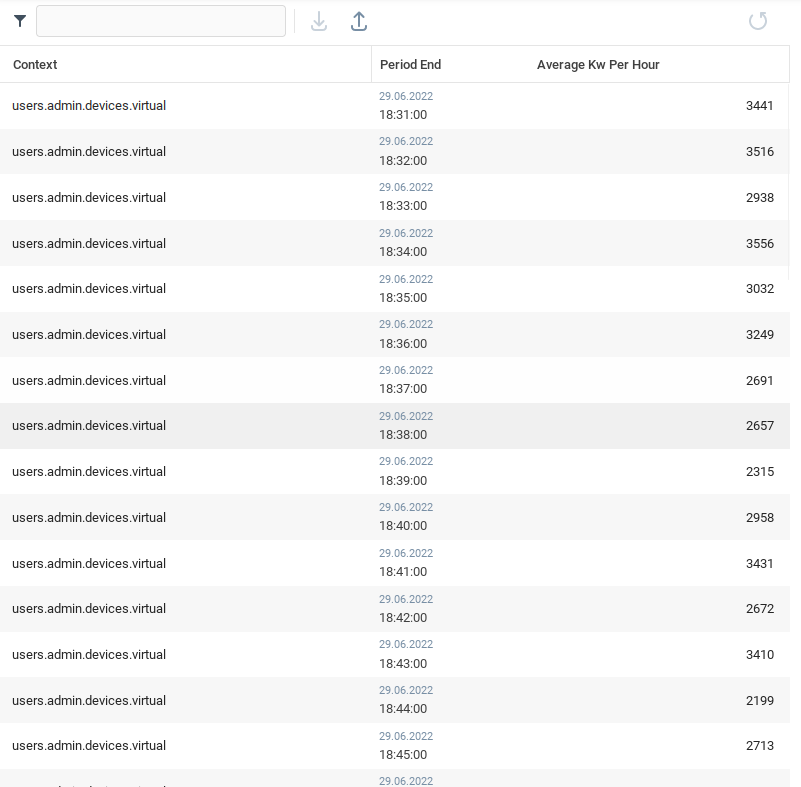
Our Dashboard should look something like the below. We now have a table showing the average energy consumption rate of our device. You could consider adding labels and other design elements to improve the user experience of your report.
Was this page helpful?