Intelligent Baseline Alerts
Simple alerts are often configured to raise once a certain metric exceeds a pre-defined threshold. For example, an alert can be raised once CPU load on a server stays over 80% for longer than one hour.
Such an alert setup can be used to ensure verification of well-established Service Level Agreements (SLAs). However, in some cases an alert should be triggered if the spot value of a metric or its short-term average significantly exceeds its long-term average. This situation may point to a forthcoming problem, even if the current value is lower than the SLA level.
This tutorial explains how to set up an alert that is raised if the last hour's average CPU load on a server exceeds the previous month's average by 20 percent.
Creating a Statistical Channel
First of all, we need to set up a statistical channel for calculating CPU load averages on our server. Detailed instructions can be followed from the Predicting SLA Breakdowns tutorial.
To create a statistical channel select Edit Device Properties from popup menu of a network device, switch to Statistical Channels tab and add a new row to the channels table. We set the Variable to point to the variable containing the CPU load values, in our case hrProcessorTable.
Open Parameters fields and set up the Expression that will return numeric values to be averaged and monitored by the alert. In our case we return the exact value of the variable being monitored{hrProcessorTable}, but any operations available to the expression language can be applied if needed.
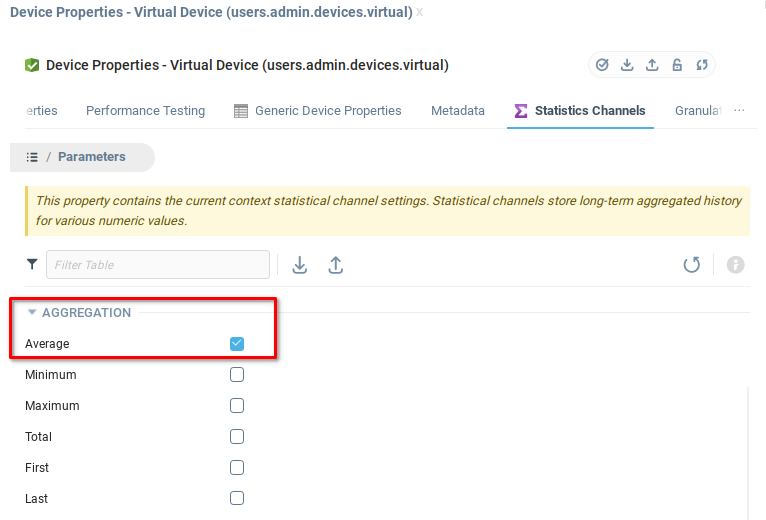
We disable all Aggregation types except for Average. This will save some space in the statistics database.

Creating the Alert
Create a new alert that will be raised upon serious baseline violation. Set up alert's notifications (such as mail or SMS sending).
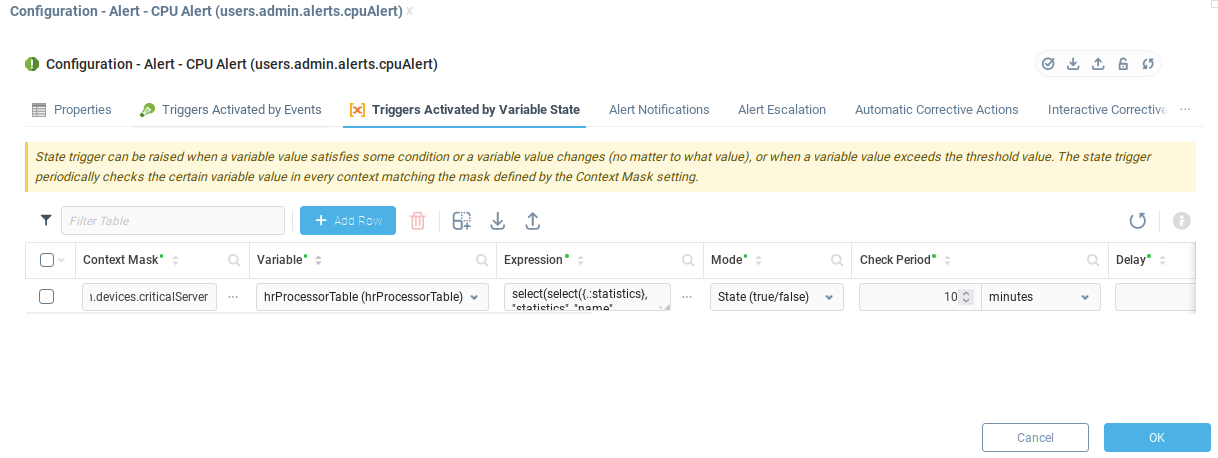
Add one Trigger Activated by Variable State to the alert, and set it up as follows:
Context Mask:
users.admin.devices.criticalServer(context of the server which CPU load is tracked)Variable:
hrProcessorTable(CPU Load Table)Expression:
select(select({.:statistics}, "statistics", "name", "cpuLoad"), "average", "period", 3) > select(select({.:statistics}, "statistics", "name", "cpuLoad"), "average", "period", 6) + 20Mode
State (True/False)Delay:
0 ms
The Check Period should not be very short, since the statistics-based baseline calculation is a resource-consuming task. 10 minutes or longer Check Period should be sufficient.

The Expression of this alert compares last day and last month CPU load averages by retrieving them from statistics variable.
Let's analyze the first part, select(select({.:statistics}, "statistics", "name", "cpuLoad"), "average", "period", 3). First, select({.:statistics}, "statistics", "name", "cpuLoad") retrieves statistical values for cpuLoad channel from the value of statistics variable. Second, select(statistics, "average", "period", 3) function returns a last day average (in percents) from the previous table.
 | Numeric constant |
The second part of expression obtains the last month average in the same way. Finally, if the last hour average is greater than the last month average by 20% or more, the whole expression will result to true and the alert will be raised.
Was this page helpful?