XY Plot
XY Plot draws a visual representation of (X, Y) value pairs, where the domain axis measures the X-values and the range axis measures the T-values.
This plot supports panning and zooming along both axes.
XY plot is typically displayed using a vertical orientation, but it is possible to change to a horizontal orientation which can be useful for certain applications.
Plot Layout
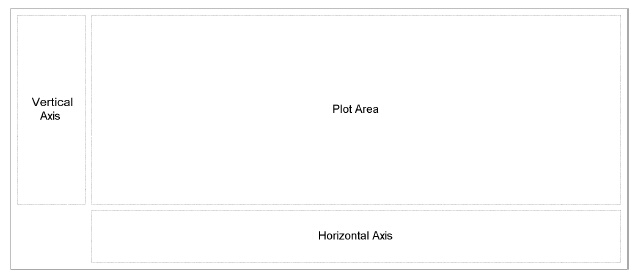
Axes are laid out at the left and bottom of the drawing area. The space allocated for the axes is determined automatically. The following diagram shows how this area is divided:

Determining the dimensions of these regions is an awkward problem. The plot area can be resized arbitrarily, but the vertical axis and horizontal axis sizes are more difficult. Note that the height of the vertical axis is related to the height of the horizontal axis, and, likewise, the width of the vertical axis is related to the width of the horizontal axis. This results in a "chicken and egg" problem, because changing the width of an axis can affect its height (especially if the tick units change with the resize) and changing its height can affect the width (for the same reason).
Domain Zoomable
Controls whether mouse zooming along the domain axis is enabled.
Property name: domainZoomable
Property type: Boolean
Range Zoomable
Controls whether mouse zooming along the range axis is enabled.
Property name: rangeZoomable
Property type: Boolean
Quadrants
The XY Plot provides an optional facility to specify a background color for each quadrant in the plot.
Quadrant Origin
The quadrant origin, in chart data space, specified by X and Y coordinates. By default, the origin is (0, 0).
Property name: quadrantOrigin
Property type: Data Table
Quadrants Paint
Property | Name | Type | Description |
Quadrant | quadrant | Integer | Quadrant specification. There are four quadrants:
|
Paint | paint | Data Table | Paint used to fill the quadrant. If null, quadrant it not filled. |
Property name: quadrantsPaint
Property type: Data Table
Markers
Markers are used to highlight different X-values (domain markers) or Y-values (range markers).
Each marker may be put on one of two layers:
- Foreground layer: the marker will be drawn over series data
- Background layer: the marker will be drawn below series data
Domain Markers
A table containing X-value markers and their layers.
Property name: domainMarkers
Property type: Data Table
Range Markers
A table containing Y-value markers and their layers.
Property name: rangeMarkers
Property type: Data Table
Plot Annotations
Annotations can be added to a plot to highlight data items of interest. The following standard annotation types are available:
- Box Annotation
- Data Image Annotation
- Image Annotation
- Legend Annotation
- Line Annotation
- Pointer Annotation
- Polygon Annotation
- Shape Annotation
- Text Annotation
- Title Annotation
 | Renderer Annotations have several advantages over plot's annotations. |
Annotations
The list of annotations.
Property name: annotations
Property type: Data Table
Tick Bands
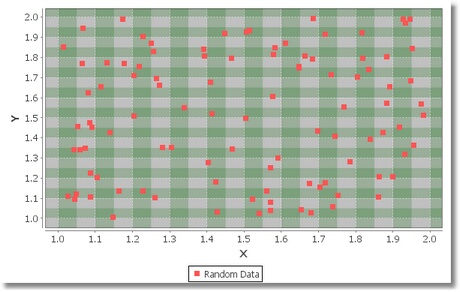
The XY Plot can color alternate bands between the tick marks on the plot's axes.
Tick bands example:

Tick bands are controlled by two properties:
Domain Tick Band Paint
Paint used to fill alternate bands between the tick values on the domain axis. If paint is null, no bands will be filled.
Property name: domainTickBandPaint
Property type: Data Table
Range Tick Band Paint
Paint used to fill alternate bands between the tick values on the range axis. If paint is null, no bands will be filled.
Property name: rangeTickBandPaint
Property type: Data Table
Axes Properties
An XY plot usually has a single domain axis and a single range axis. However, additional axes may be added.
The plot's axes can appear at the top, bottom, left or right of the plot area. The location for an axis combines two possible options. Option which is actually used depends on the orientation (horizontal or vertical) of the plot. For "vertical" plots (the usual default), the domain axis will appear at the top or bottom of the plot area, and the range axis will appear at the left or right of the plot area. For "horizontal" plots, the domain axis will appear at the left or right of the plot area, and the range axis will appear at the top or bottom of the plot area.
Axis Offset
The axes can be offset slightly from the edges of the plot area, if required. This property controls the offset between the plot area and the axes. See Rectangle Insets.
Property name: axisOffset
Property type: Data Table
Domain Axes
The table containing chart's domain (X-value) axes and their positions.
There are four domain axis location options:
- Top or Left: top side if plot orientation is vertical and left side if plot orientation is horizontal
- Top or Right: top side if plot orientation is vertical and right side if plot orientation is horizontal
- Bottom or Left: bottom side if plot orientation is vertical and left side if plot orientation is horizontal
- Bottom or Right: bottom side if plot orientation is vertical and right side if plot orientation is horizontal
Property name: domainAxes
Property type: Data Table
Range Axes
The table containing chart's range (Y-value) axes and their positions.
There are four range axis location options:
- Top or Left: top side if plot orientation is horizontal and left side if plot orientation is vertical
- Top or Right: top side if plot orientation is horizontal and right side if plot orientation is vertical
- Bottom or Left: bottom side if plot orientation is horizontal and left side if plot orientation is vertical
- Bottom or Right: bottom side if plot orientation is horizontal and right side if plot orientation is vertical
Property name: rangeAxes
Property type: Data Table
Domain Zero Baseline Visible
Flag that controls whether or not the zero baseline against the domain axis is visible.
Domain Zero Baseline is a base line against the domain axis at the zero value.
Property name: domainZeroBaselineVisible
Property type: Data Table
Domain Zero Baseline Stroke
Stroke used for the zero baseline against the domain axis.
Property name: domainZeroBaselineStroke
Property type: Data Table
Domain Zero Baseline Paint
Paint used for the zero baseline against the domain axis.
Property name: domainZeroBaselinePaint
Property type: Data Table
Range Zero Baseline Visible
Flag that controls whether or not the zero baseline against the range axis is visible.
Range Zero Baseline is a base line against the range axis at the zero value.
Property name: rangeZeroBaselineVisible
Property type: Data Table
Range Zero Baseline Stroke
Stroke used for the zero baseline against the range axis.
Property name: rangeZeroBaselineStroke
Property type: Data Table
Range Zero Baseline Paint
Paint used for the zero baseline against the range axis.
Property name: rangeZeroBaselinePaint
Property type: Data Table
Fixed Axis Dimensions
The width and height of the axes are normally determined automatically to allow just the required amount of space, no more and no less. Occasionally, you may want to override this behaviour and specify a fixed amount of space to allocate to each axis. As an example, this can make it easier to align the contents of multiple charts.
The fixed axis space table contains four values (Top, Bottom, Left and Right) that define the space allocated for axes located at the top, bottom, left, and right part of a plot respectively. Since the plot may contain many axes these values are used to collate the space requirements for all the axes.
Fixed Domain Axis Space
Specifies a fixed amount of space to allocate to the domain axis.
Property name: fixedDomainAxisSpace
Property type: Data Table
Fixed Range Axis Space
Specifies a fixed amount of space to allocate to the range axis.
Property name: fixedRangeAxisSpace
Property type: Data Table
Crosshairs
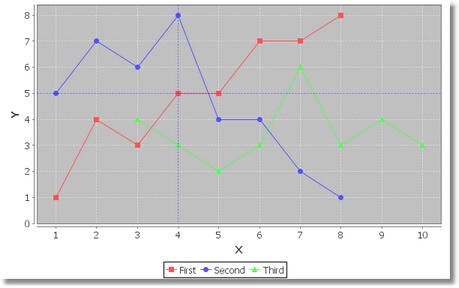
Category plot has support for crosshairs against the primary domain and range axes.
 | Crosshairs may be set up by clicking on a chart within a working widget. |
Example chart with both domain and range crosshairs:

Domain Crosshair Visible
Flag that controls the visibility of the domain crosshair.
Property name: domainCrosshairVisible
Property type: Boolean
Domain Crosshair Value
Value for the domain crosshair point.
Property name: domainCrosshairValue
Property type: Float
Domain Crosshair Stroke
Stroke used to draw the domain crosshair if it is visible.
Property name: domainCrosshairStroke
Property type: Data Table
Domain Crosshair Paint
Paint used to draw the domain crosshair if it is visible.
Property name: domainCrosshairPaint
Property type: Data Table
Domain Crosshair Locked on Data
Flag that controls whether or not the domain crosshair point locks onto the nearest data value when it is set up by clicking on a chart.
Property name: domainCrosshairLockedOnData
Property type: Boolean
Range Crosshair Visible
Flag that controls whether or not a range crosshair is drawn.
Property name: rangeCrosshairVisible
Property type: Boolean
Range Crosshair Value
Value for the range crosshair point.
Property name: rangeCrosshairValue
Property type: Float
Range Crosshair Stroke
Stroke used to draw the range crosshair if it is visible.
Property name: rangeCrosshairStroke
Property type: Data Table
Range Crosshair Paint
Paint used to draw the range crosshair if it is visible.
Property name: rangeCrosshairPaint
Property type: Data Table
Range Crosshair Locked on Data
Flag that controls whether or not the range crosshair point locks onto the nearest data value when it is set up by clicking on a chart.
Property name: rangeCrosshairLockedOnData
Property type: Boolean
Gridlines
The XY Plot provides support for drawing gridlines against the primary domain axis and the primary range axis. For each axis, there is a flag that controls whether or not the gridlines are visible. For visible gridlines, you can customize the line style (Stroke) and color (Paint).
Domain Gridlines Visible
Flag that controls whether gridlines are drawn against the domain axis.
Property name: domainGridlinesVisible
Property type: Boolean
Domain Gridline Stroke
Stroke used to draw the domain gridlines.
Property name: domainGridlineStroke
Property type: Data Table
Domain Gridline Paint
Paint used to draw the domain gridlines.
Property name: domainGridlinePaint
Property type: Data Table
Range Gridlines Visible
Flag that controls whether gridlines are drawn against the range axis.
Property name: rangeGridlinesVisible
Property type: Boolean
Range Gridline Stroke
Stroke used to draw the range gridlines.
Property name: rangeGridlineStroke
Property type: Data Table
Range Gridline Paint
Paint used to draw the range gridlines.
Property name: rangeGridlinePaint
Property type: Data Table
Domain Minor Gridlines Visible
Flag that controls whether or not gridlines are shown for the minor tick values on the primary domain axis.
Property name: domainMinorGridlinesVisible
Property type: Boolean
Domain Minor Gridline Stroke
Stroke used to draw the domain minor gridlines.
Property name: domainMinorGridlineStroke
Property type: Data Table
Domain Minor Gridline Paint
Paint used to draw the domain minor gridlines.
Property name: domainMinorGridlinePaint
Property type: Data Table
Range Minor Gridlines Visible
Flag that controls whether or not gridlines are shown for the minor tick values on the primary range axis.
Property name: rangeMinorGridlinesVisible
Property type: Boolean
Range Minor Gridline Stroke
Stroke used to draw the range minor gridlines.
Property name: rangeMinorGridlineStroke
Property type: Data Table
Range Minor Gridline Paint
Paint used to draw the range minor gridlines.
Property name: rangeMinorGridlinePaint
Property type: Data Table
Other Properties
Orientation
Plot orientation (Vertical or Horizontal). Default is Vertical.
Property name: orientation
Property type: String
Domain Pannable
A flag that controls whether or not panning is enabled for the domain axis/axes.
Property name: domainPannable
Property type: Boolean
Range Pannable
A flag that controls whether or not panning is enabled for the range axis/axes.
Property name: rangePannable
Property type: Boolean
Fixed Legend Items
A collection of legend items for the plot, used to override the auto-generated set of legend items if non-empty.
Property name: fixedLegendItems
Property type: Data Table
Was this page helpful?