Gantt Chart
A gantt chart is used to draw simple Gantt diagrams. |
|

 | A Gantt chart is a type of bar chart that illustrates a project schedule. Gantt charts illustrate the start and finish dates of the individual tasks within a project. |
The gantt chart is based on Category Plot and Category Bar Renderer. It inherits all their properties.
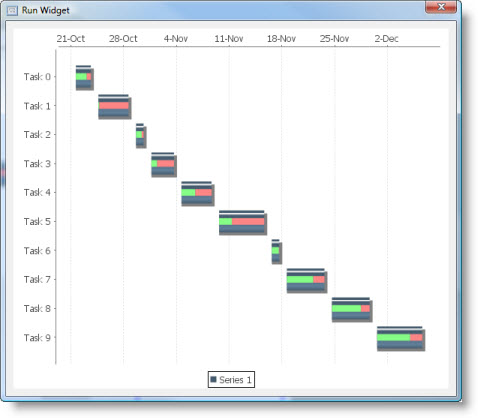
This is what gantt chart looks like:
Dataset
The gantt chart supports Custom Data model only.
It has the following Source Data Bindings:
Binding | Expected Value Type | Description |
Series | String | Textual name of the data series. Series are usually used to indicate project names in the multi-project charts. |
Description | String | Description of the task. Tasks are displayed along the domain axis. If one series contains several tasks with the same description, they will be displayed on the chart as several bars (subtasks) corresponding to one task. |
Start Date | Date or Number | Task start timestamp. Numeric values are converted to dates by treating them as number of milliseconds since the January 1, 1970. |
End Date | Date or Number | Task end timestamp. |
Percent Complete | Number | Task completion percentage. |
Common Properties
Width, Height, Bindings, Visible, Opaque, Background, Border
Source Data and Source Data Bindings properties.
All properties of a Category Plot.
All properties of a Category Bar Renderer.
Custom Properties
Complete Paint
Paint used to draw the portion of the task that is completed.
Property name: completePaint
Property type: Data Table
Incomplete Paint
Paint used to draw the portion of the task that is not yet completed.
Property name: incompletePaint
Property type: Data Table
Start Percent
Start position for the "percentage complete" indicator as a percentage of the width of the task bar (for example, 0.30 is thirty percent).
Property name: startPercent
Property type: Float
End Percent
End position for the "percentage complete" indicator as a percentage of the width of the task bar (for example, 0.30 is thirty percent).
Property name: endPercent
Property type: Float
Common Events
Hidden, Shown, Moved, Resized, Mouse Clicked, Mouse Pressed, Mouse Released, Mouse Entered, Mouse Exited, Mouse Moved, Mouse Wheel Moved, Key Typed, Key Pressed, Key Released, Focus Gained, Focus Lost
All relevant chart events.
Additional Examples
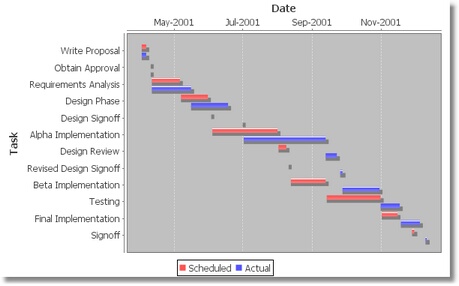
A simple Gantt chart showing actual vs. scheduled progress:
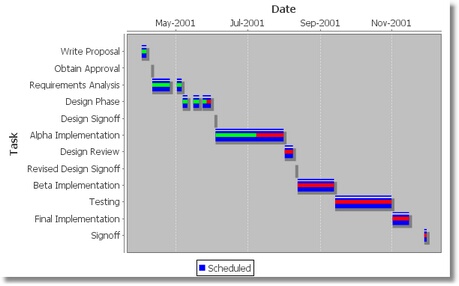
A simple Gantt chart showing progress-to-date on a set of tasks:
Was this page helpful?